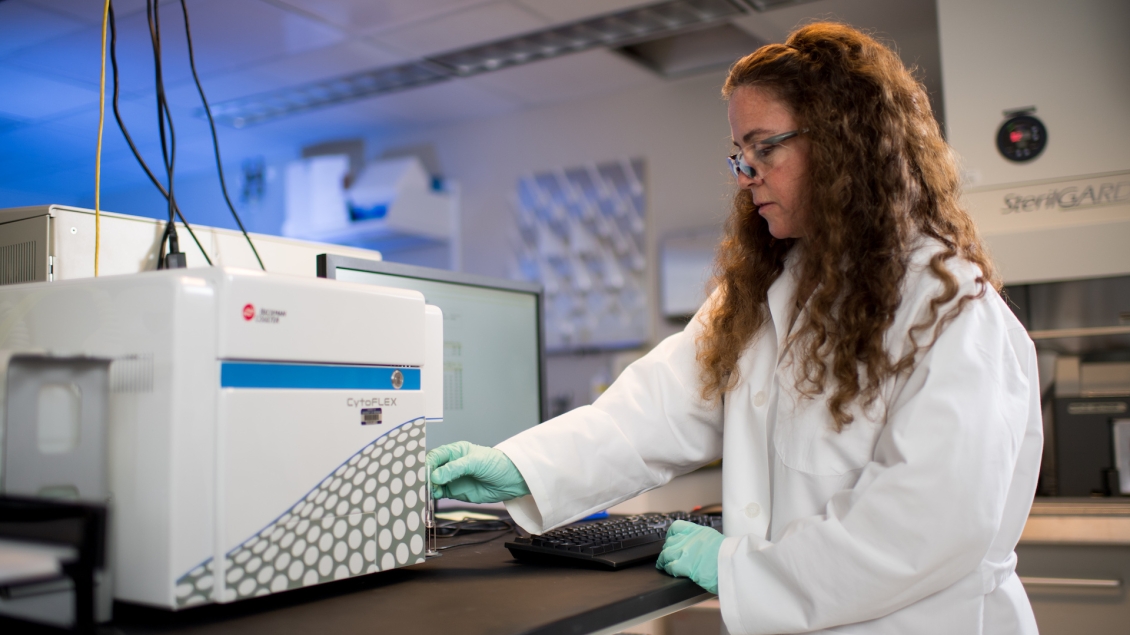
Introducing investigators to the power of flow cytometry.
No training is required to bring samples to the facility to be run by our trained technicians. However, we do offer training on all core instrumentation for those users wanting to take advantage of the discounted rate for self-operation or for those wanting to utilize the equipment during the off-hours.
The training consists of two steps. The first is a mandatory lecture. This lecture is held monthly on the second tuesday of the month at 10:30am at BSRB or the fourth friday of the month at 11:00am at NCRC. Please verify lecture location with Core staff.
Following the initial lecture, analyzer users will be allowed to schedule for a one-hour “hands on” training session on the analyzer of their choice or a 1.5 hour “hands-on” training session on one of the Sony cell sorters. Additional training time can be scheduled as required. Generally a minimum of three hands-on sessions are required when learning your first instrument.
When the trainee feels comfortable on the platform, they can request that a practical exam (Start instrument, QC instrument, create new protocol, optimize and run samples, export data, and shut down instrument) be scheduled. Once the exam has been passed, the user will be granted self-operation privileges. Those requesting cell sorter training on one of the higher-end platforms (Aria, Astrios, Bigfoot, S8) must first demonstrate a marked aptitude in flow cytometry operation and have already been trained on another core instrument.
Contact at David Adams with questions or to schedule.
The following online tutorial modules have been prepared by David Adams, the Managing Director for the Flow Core, who has been working in and training people in flow cytometric techniques since 1992.
Each section and associated exercise should take no longer than one hour to complete.
Before one can begin to design and interpret flow cytometry experiments, a firm grasp of the flow cytometry basics is required. In this lesson we will cover:
- Cellular Flow
- “Scatter” signals
- Fluorescent Signals
Definition
Before discussing the details of flow cytometry, let’s first define the terms.
Cytometry: The characterization and measurement of cells and cellular constituents.
Flow: To issue or move in a stream
Flow Cytometry, then, can be defined as the characterization and measurement of cells and cellular constituents as they travel in a stream. In the most basic sense, this is an accurate description. In order to take measurements, a laser beam is focused on the stream as cells travel single-file through the stream.
Hydrodynamic Focusing
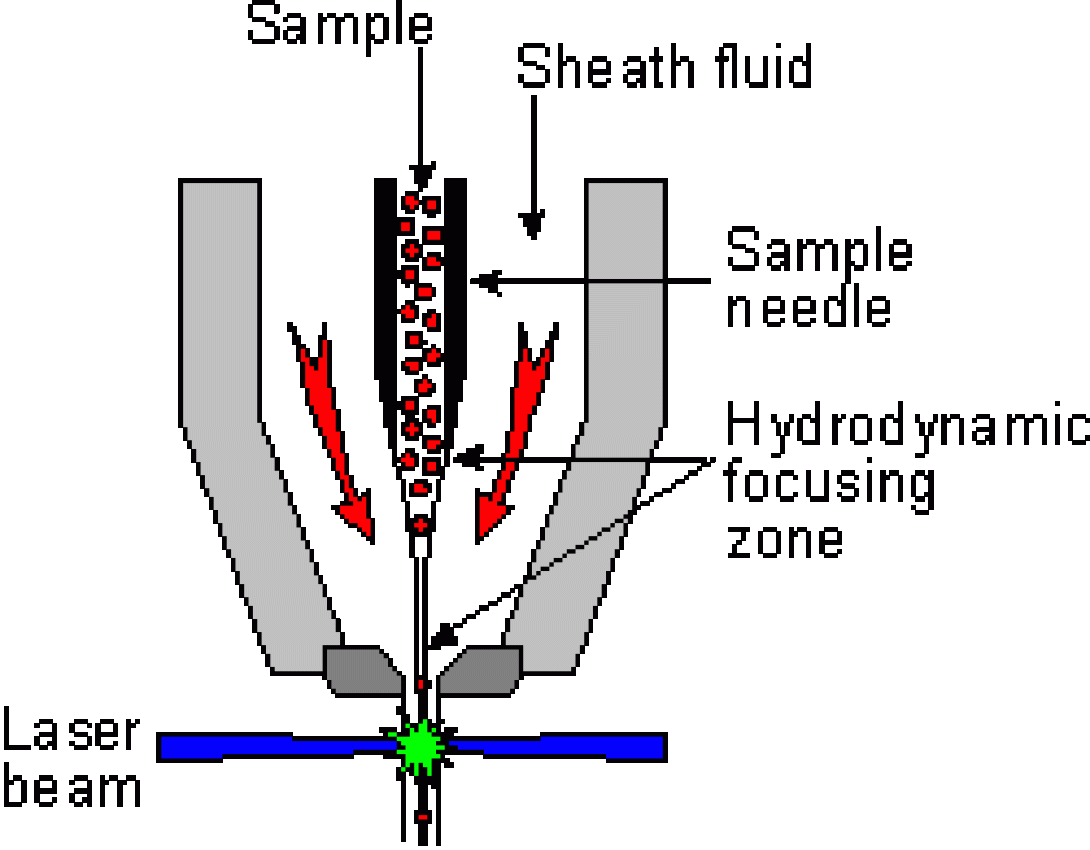
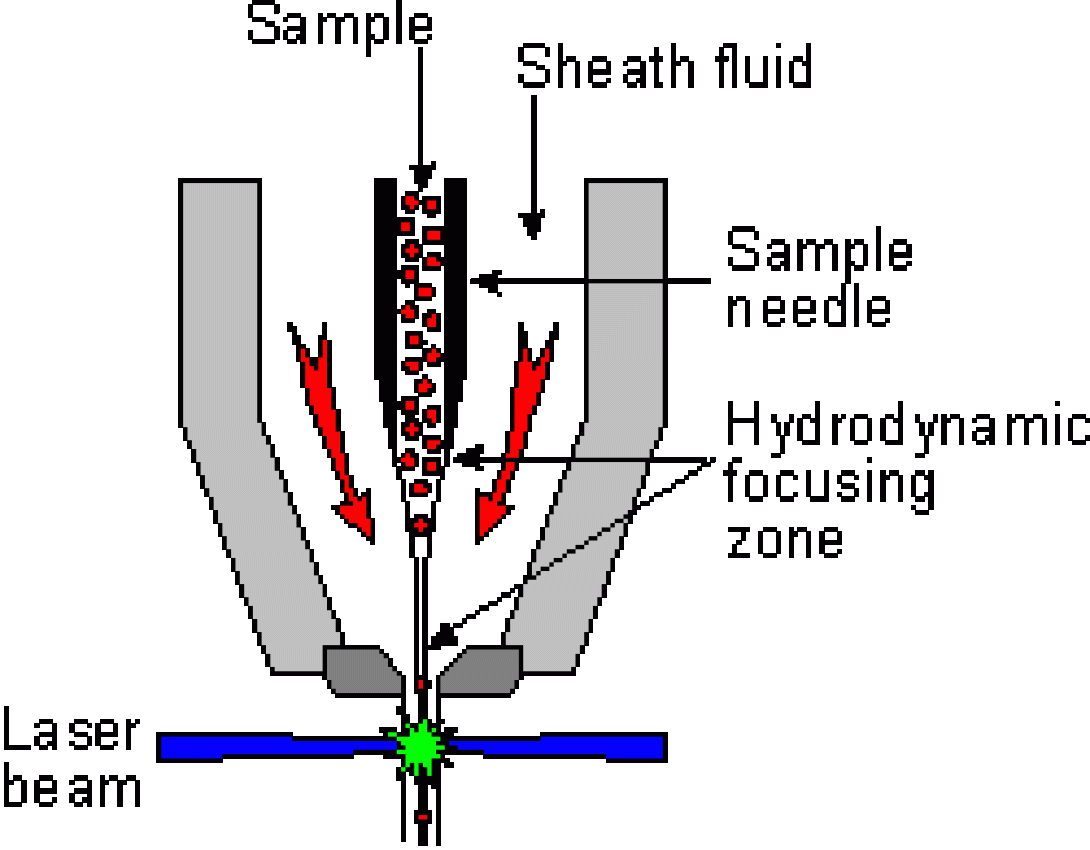
In order to make accurate measurements, the cells must be measured one at a time and, therefore, must travel single-file through the stream at the point of laser interrogation. The method of achieving this ordered stream is known as hydrodynamic focusing.
Within the flow cell, a slow-moving sample stream is injected into a faster moving “sheath” stream (generally PBS). Surface tension and laminar flow causes the sample stream to be “wicked off” the injection point into a narrow, faster moving stream within the sheath stream (stream within a stream). Careful control of the velocity of the two streams allow for fine control of the width of the center stream and, therefore, the alignment of the cells within the center stream.
Scattered Light
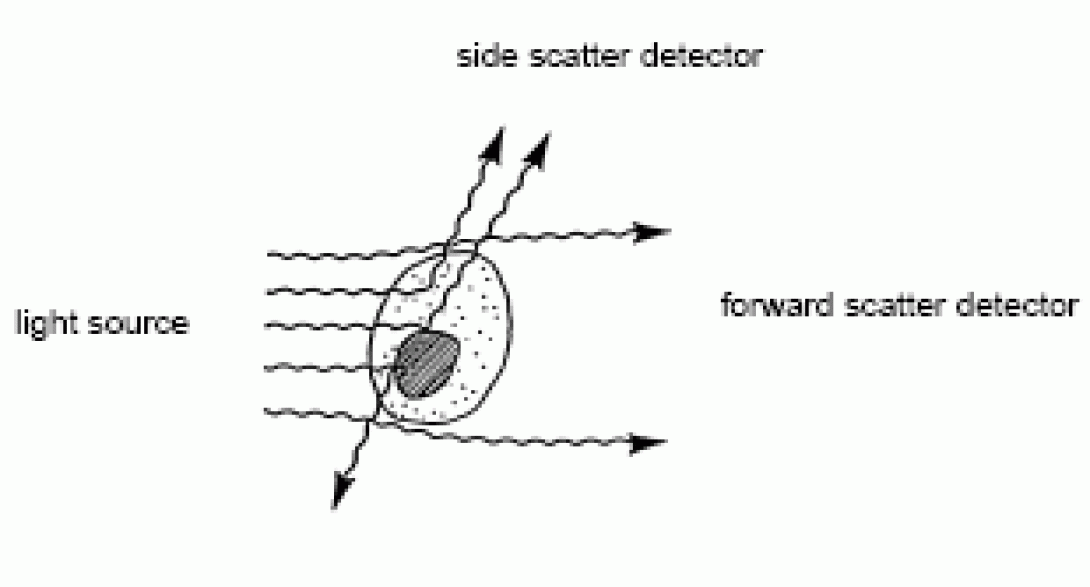
When the laser beam strikes the stream, the majority of the photons will pass through unobstructed. Some of these photons will diverge slightly, primarily via light diffraction, from their path as they contact the membranes of passing cells. A detector is placed in line with the laser path (on the opposite side of the stream) and this “scattered” light is collected. Because of the nature of its collection, this parameter is referred to as Small Angle Light Scatter (SALS), Forward Angle Lights Scatter (FALS), or, most commonly, Forward Scatter (FSC). Forward scatter is proportional to cell size; the bigger the cell, the more light is scattered, the higher the detected signal.
As cells are translucent, many photons will pass through the cytoplasm. If the photon strikes an organelle (ER, nucleus, etc), the photon will be reflected at a larger angle than those generated by the forward scatter phenomenon. In a typical cytometer, a second detector is placed perpendicular to the laser path to collect light scattered in this manner. This is known as Wide Angle Light Scatter (WALS), Orthogonal Light Scatter (OLS), 90° Lights Scatter, or, commonly, Side Scatter (SSC). Side scatter is proportional to cell complexity; the more organelles/bits inside the cytoplasm, the more light scatter, the higher the detected signal.
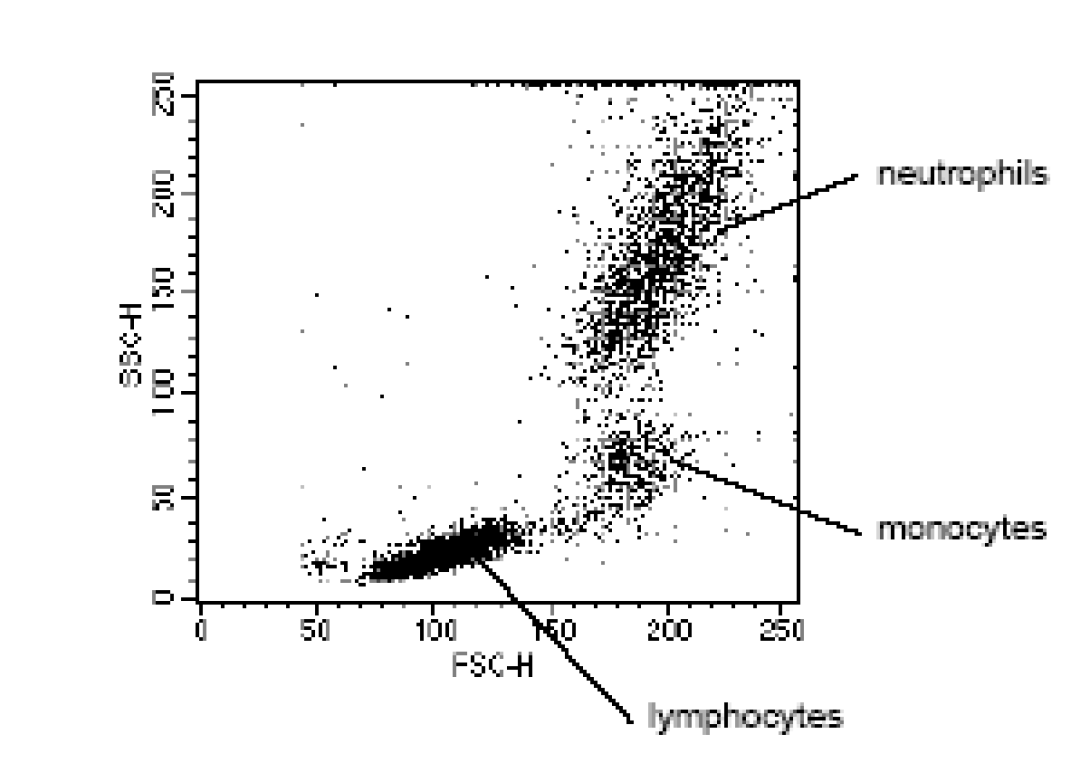
Let’s briefly consider the power of this simple technique. If cells are passed through a cytometer with minimal preparation, the cells can already be separated into constituent sub-populations simply by the scattering of the laser light source. The image to the left shows a typical lysed, whole blood preparation. Forward Scatter is plotted on the x-axis with Side Scatter plotted on the y-axis. Each dot represents one cellular event. The scale (0-250) is an arbitrary scale representing increasing intensity of signal. As the image shows, light scatter allows for easy differentiation of small lymphocytes from the larger monocytes and differentiation of the monocytes from the similarly sized but significantly more complex neutrophils. If the cytometer is capable of cell sorting, any of these populations could be separated and collected for further study.
Fluorescence
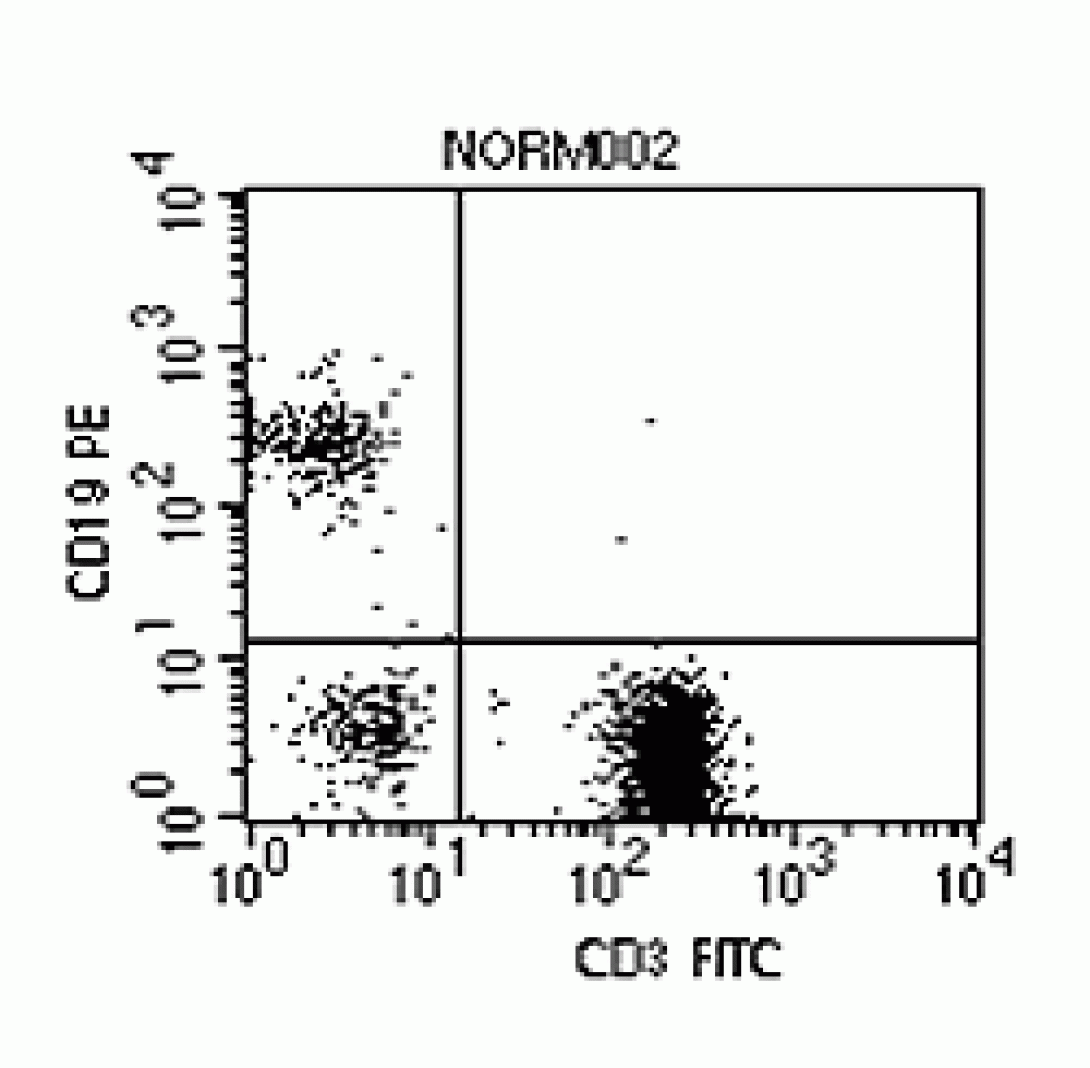
If Flow Cytometry ended with light scatter, it would be a useful technique but certainly would not play its important role in research and clinical science. By adding fluorescent labeling, however, the analysis can be taken beyond morphological characteristics into the arena of functional characteristics. Consider the cell membrane. It is riddled with antigen-specific binding sites. These binding sites relate to specific cell functional roles. For instance, T-cells present CD3 binding sites. B-cells present CD19 binding sites. Therefore, if one took a sample of Anti-CD3 antibodies conjugated with a fluorescent molecule (such as Fitc), one could use the sample to “stain” the T-cells within a sample. As these cells passed through the stream, the laser light would excite the fluorescent tag, or fluorochrome, which would emit photons of light at a higher wavelength (Fitc emits light at ~530nm when excited by a 488nm laser). This light can be collected and used to further categorize the cells. The figure at the left shows a sample which has been stained with Anti-CD3 Fitc, Anti-CD19 PE (~580nm). Notice that the plot shows T-cells (lower right quadrant), B-Cells (upper left), and cells which appear to be neither T- nor B-cells (lower left). Again, if the instrument is capable of cell sorting, these populations could be isolated for further study.
Fluorescence is not limited to antibody conjugation of course. Any source of fluorescence which can be coupled to a functional characteristic is applicable. Intercellular dyes such as Hoechst or Propidium Iodide are used to measure DNA content. Viral transduction efficiency can by measured by the introduction of a fluorescent protein along with the target DNA sequence. The number of parameters than can be measured then is limited only by the availability of distinct fluorescent markers and the specifics of the cytometer hardware (wavelength of installed laser(s), number of detectors, etc).
Wrapping Up
If you would like to see the entire process described above, ImmunoTeach offers this short video (quicktime required). In order to asses your understanding of the material thus far, please email the answers to the following questions to David Adams.
- In regards to hydrodynamic focusing, what effect would increasing the speed of the center, sample, stream have on the resolution of signals?
- What will be the effect of ethanol fixation of cells prepared for flow cytometry using a green intracellular stain
While the software package utilized within the flow core is CellQuest Pro, the software is dongle-protected and quite expensive. As such, you will practice data analysis with a similar program known as Weasel.
Weasel is a flow cytometry data analysis program available for download from the Walter and Eliza Hall Institute of Medical Research. As it is java-based, it will run on most modern platforms. Please visit the Weasel download page and download the appropriate version for your computer. Please be sure to follow the installation instructions carefully. Java and Quicktime may also be required if not already present on your system. (Note: If you are running on an HITS-administered workstation, you may need to contact the help desk in order to have the software installed).
You may, of course, use any other cytometry analysis program which is already installed on your system. The University offers substantial discounts on many cytometry software packages. Be sure to contact M-Stores Customer Service prior to any purchase.
Finally, download the data files to be used for this exercise. If you need the files in another format please email David Adams.
Platform Tips
- Windows: Depending upon your version of windows, weasel should be started by the Weasel.bat (win9x/NT) or the Weasel.jar (XP/2000) file.
- Mac OSX: Weasel utilizes a two mouse-button scheme. When the instructions refer to a “right click”, simply press and hold the control or option keys while clicking to emulate a right click.
- Linux/BSD: Functions identically to Windows version. Use the Weasel.jar file to start the application
Opening Data File
Open the weasel application. If you have purchased a license for the program, enter your registration code, otherwise click OK.
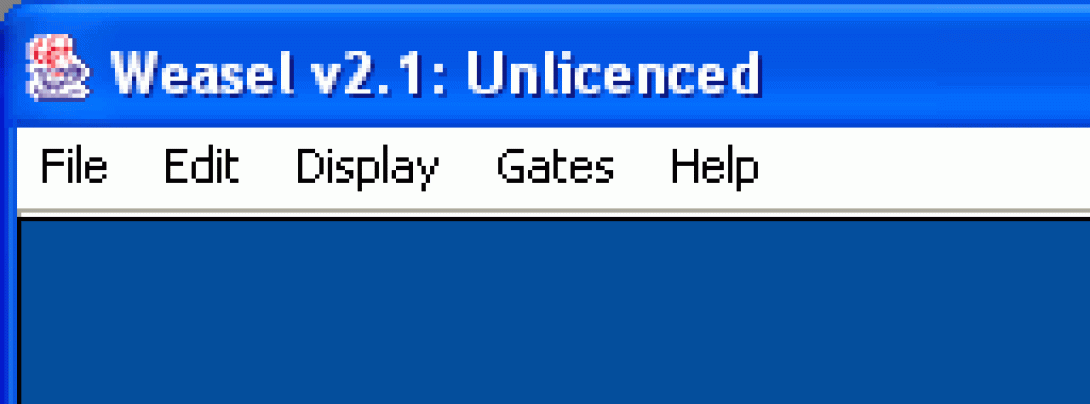
Note the pull-down menus within the program. Take the time to familiarize yourself with the various options under each menu. Weasel has a very rich documentation under the Help menu. If you are unsure or are curious about a feature, this is the first place you should look. Under the Edit menu is the Preferences option where you can customize the look and feel of the application.
From the Display Menu choose New Dot Plot. The file browser will appear. Locate and open the Norm.001 data file which you downloaded previously. The Dot Plot Format window will open. Choose the following options:
- Parameters: FSC-H vs. SSC-H
- Dimensions: Width 150 Height 150
Click OK, and the software draws a bivariate dot plot. The plot should be familiar to you from the previous lesson. Right-click in the center of the plot and choose Create a Region. Use the mouse to draw a region around the lymphocyte population (draw a polygon by clicking the vertices; click the starting point to close the region). In the Create Region dialog box, name the region “lymphs“. At this point, your plot should resemble this:
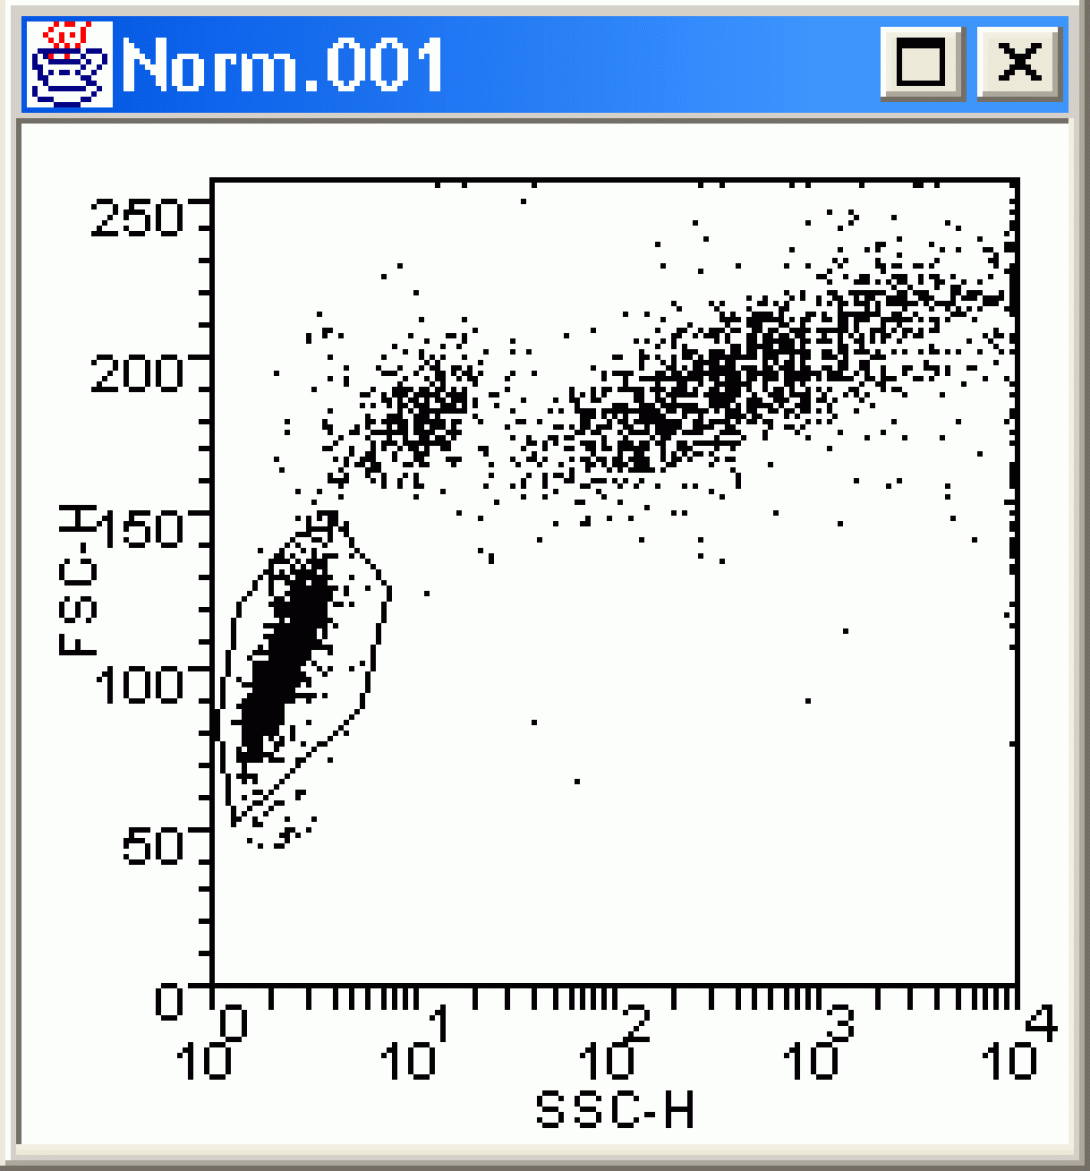
Go back to the Display menu, and again choose New Dot Plot. Choose Norm.001 and set the Parameters to Fitc vs PE. Click OK and view the new dot plot. Next, right-click in the center of the new plot and choose Change Format. In the Dot Plot Format window, choose Gate Create/Edit. A new dialog box opens (Create or Delete a Gate). Select lymphs under regions and click OK to close both dialog boxes. How is your plot different?
By creating a gate using the lymphs region, the new dot plot is only showing those cells which fall within the lymphs gate. Right-click on the plot again, and return to the Change Format window. Click the Gate Create/Edit button again, but this time choose the Not option as well as lymphs. Click OK to close the dialog boxes and look at your plot once more. How is it different? Right-click in the plot and choose the Gate option. Notice that you may now switch between no gates (None), the lymphs gate, and the NOTlymphs gate. This is a very useful technique when searching for various discreet subpopulations. Reactivate the lymphs gate.
Statistics
Right-click within the Fitc vs PE plot and choose Set Stats Markers. The Set Quadrants dialog appears as well as a set of quadrant markers on the dot plot. Click on the quadrant markers and adjust them so that the lower left quadrant encompasses the first decade on the x and y axis. Observe the quadrant percentages and ensure that there is less than 1% total events in the remaining three quadrants. Click OK. Right-click in the plot and choose Set Stats List. In the resulting dialog box, choose the following options for the Quad Stats:
- # Cells
- % Totoal
- % Gated
- Mean X
- Mean Y
Click Show Statistics. A statistics window appears attached to the dot plot. Right-click in the stats window and choose Detach Stats. Drag the stats window to a clear part of the screen and expand it so that it can be read.
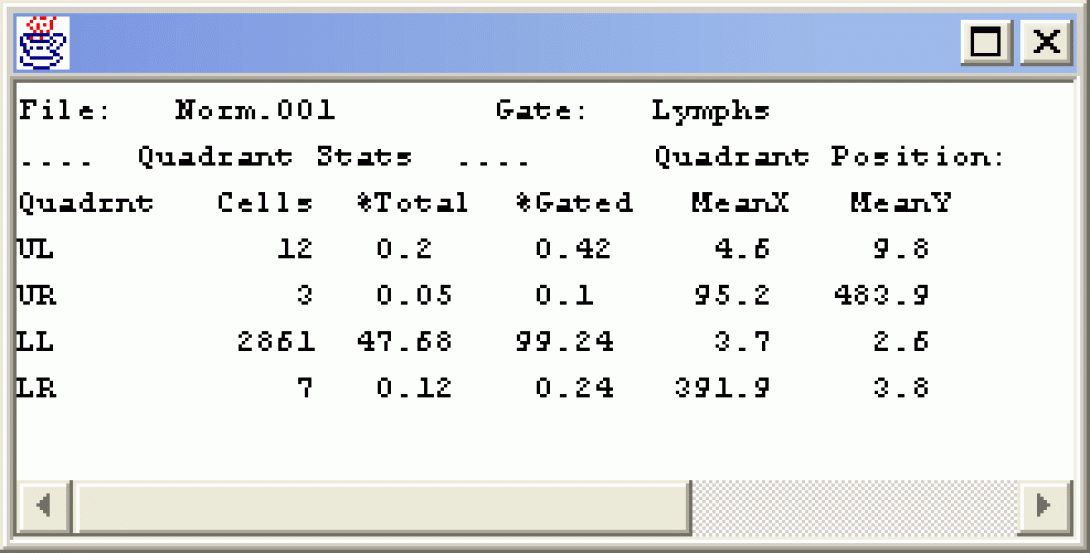
The Quad Stat is the basic statistical measure within flow cytometry. By setting the stats on a negatively stained sample, we define the scale encompassing cells as negative and anything in the other quadrants as positive. Right-Click in the Fitc vs PE plot and choose Next File. Notice how the axis labels change (CD3 Fitc vs CD19 PE). Notice also that there are distinct CD3 and CD19 positive cells, but there do not appear to be any cells that are positive for both markers. What does that tell you about CD19 positive cells? Change the Gate to NOTlymphs. How does the dot plot change?
Wrapping Up
In order to asses your understanding of the material thus far, please email the answers to the following questions to David Adams.
- Complete a Fitc vs PE sample for all twelve data files using both the lymphs gate and a new gate drawn drawn around the monocytes. Tabulate and Record the quadrant percentages (use UL,UR,LL, LR for quadrant designations) for each sample and each gate. Record your observations regarding the CD3, 4, 8 and 19 markers.
- Return to the Display menu and experiment with the Histogram, 3D Dot Plot, and Contour Plot options. What benefits do you see to each of these options? When might they be useful?
You will need to download these data files in order to complete this exercise. This exercise is again based on Weasel. If you choose to use another software package, you will need to be sure that it can perform post-acquisition compensation.
Spectral Overlap
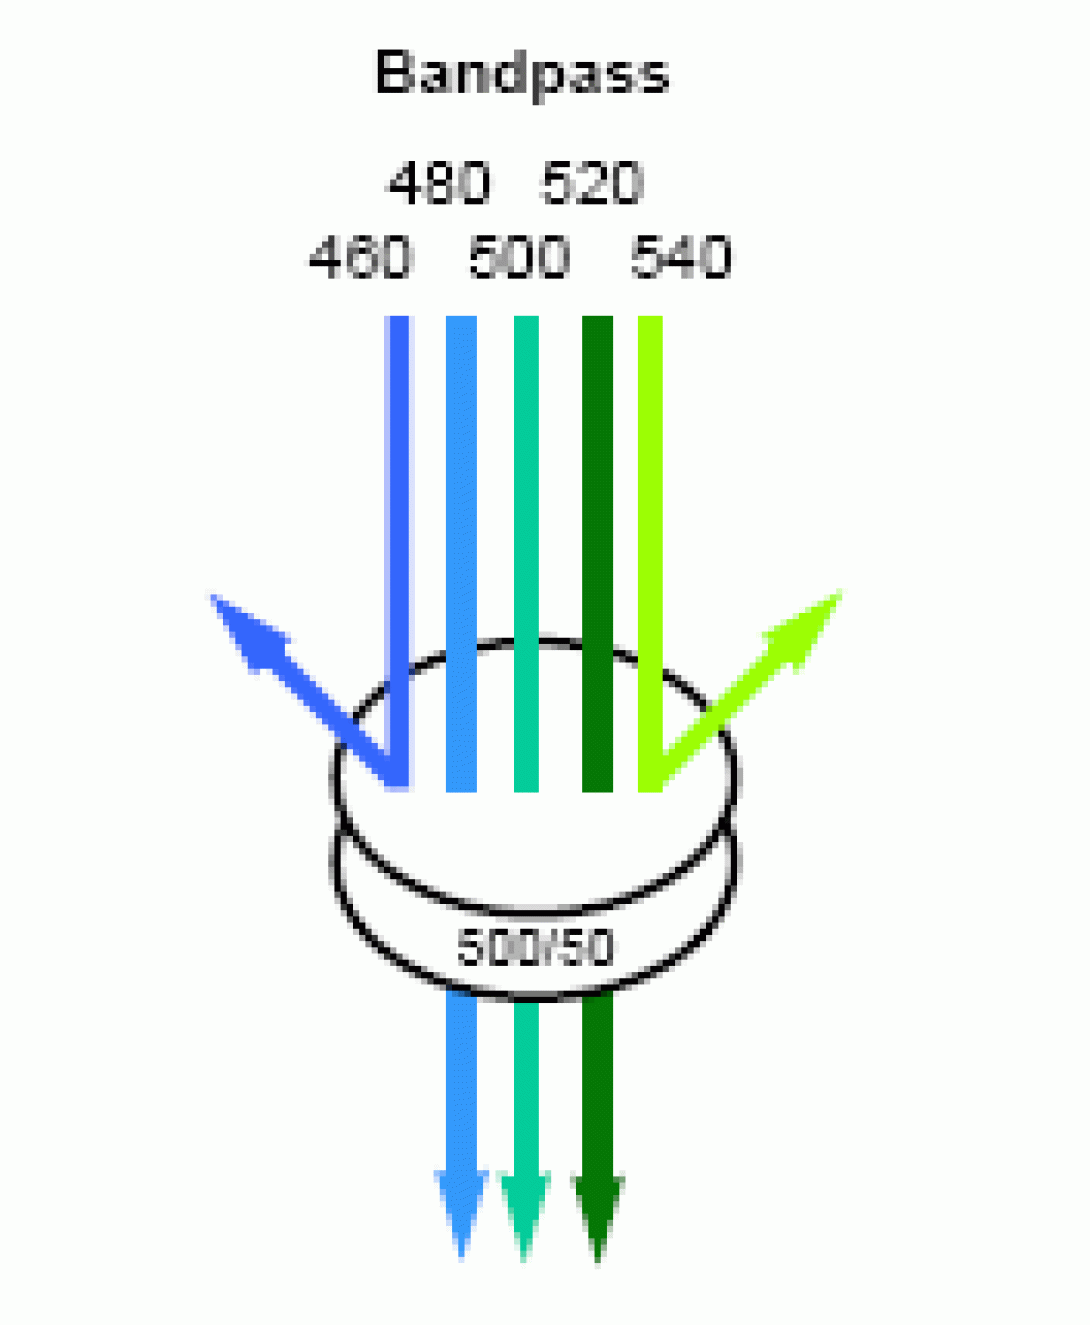
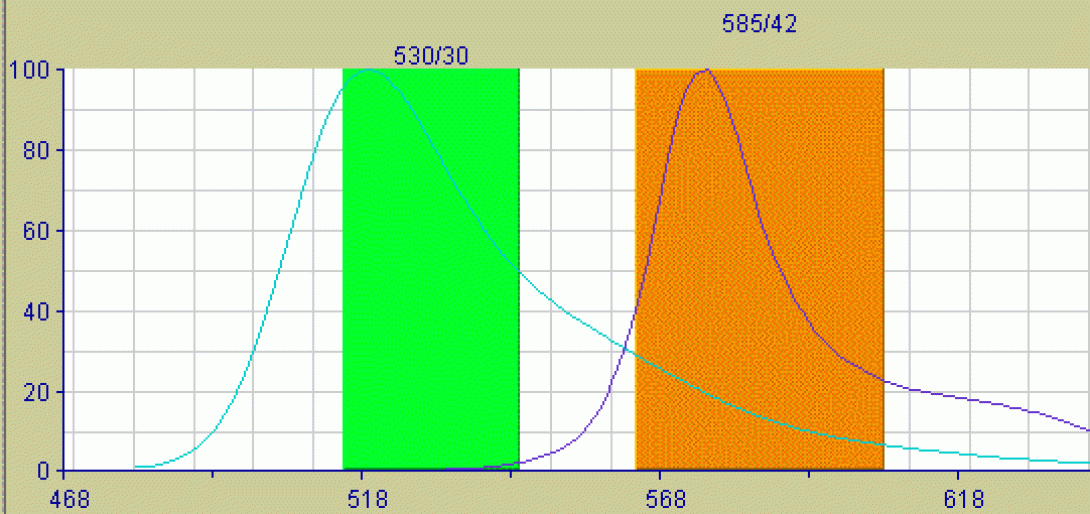
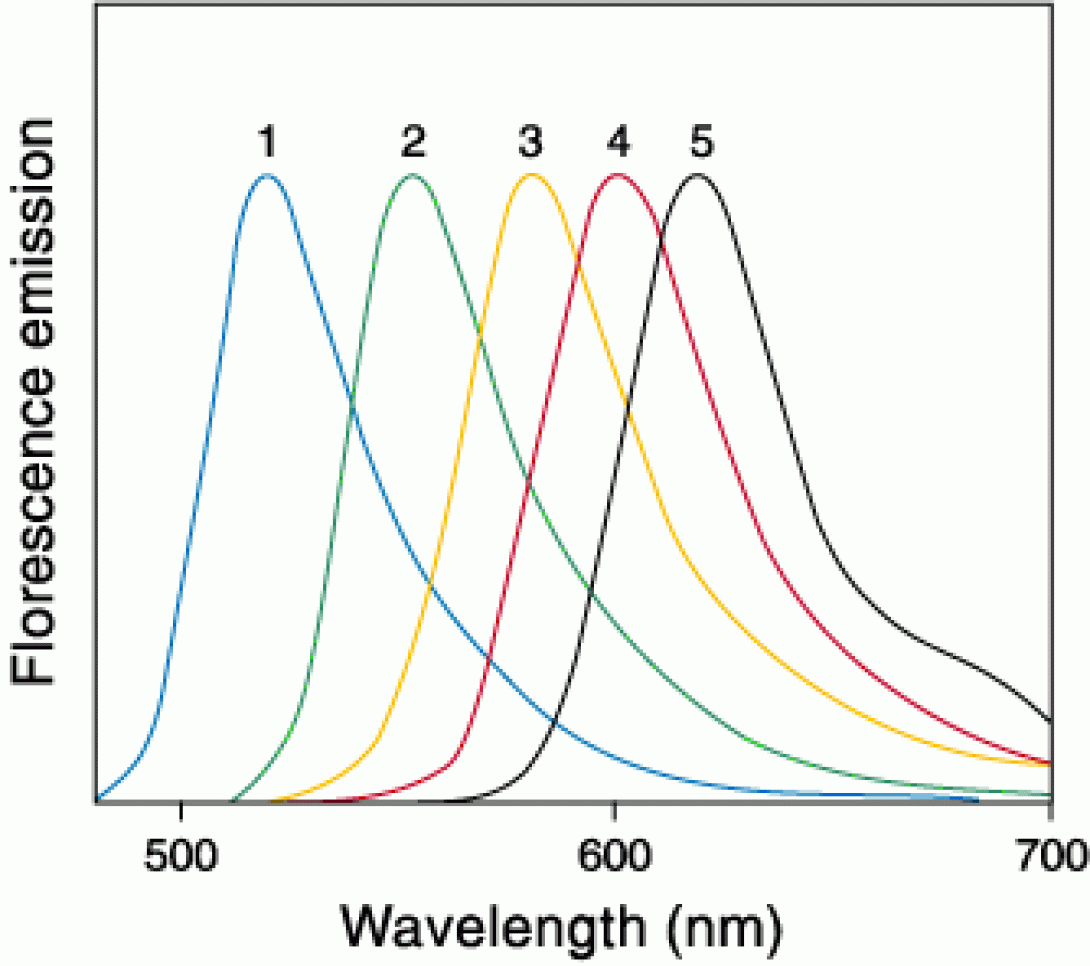
Consider the basic detection unit on any flow cytometer. The unit consists of a photodectector (photomultiplier tube or photodiode) coupled with a bandpass filter to allow only select wavelengths the detector. Now consider the emission properties of a typical fluorochrome. Though excited by a discreet wavelength from the excitation source (laser), the fluorochrome will not emit a discreet wavelength of light, but rather a spectrum, often a very broad spectrum. If two fluorochromes are used in an experiment with overlapping emission spectra, it is possible for the light emitted from both flourchromes to be detected, to some degree, in the same detector. The image below shows the emission spectra of the Fitc fluorochrome and the PE fluorochrome. The colored lines indicate the bandpass of the filters for the Fitc detector (530/30) and the PE detector (585/42). These are the specific values for the filters used in the FACSVantage SE cell sorter, but are typical values for any flow cytometer. Look closely at the image and notice that there is very little spectral overlap detectable within the Fitc Filter, but there is a significant amount of Fitc emission falling within the PE bandpass. The result of this will be an artificially elevated PE signal (false positives, inaccurate percentages). In the case of clinical diagnosis, this could prove disastrous if not corrected.
Compensation
The method for correcting for this spectral overlap is known as compensation and is really nothing more than a mathematics exercise. Since we can’t separate out the Fitc-originated photons within the 585nm bandpass from the PE-originated ones, we need to estimate the Fitc contribution and subtract it out from the gross detected signal. This is done by subtracting a percentage of the Fitc Signal detected in the Fitc Channel from the signal detected in the PE Channel (PE – %Fitc). To see how this works, open the Weasel application and create the following six plots using file COMPENSATION.001:
- Fitc vs PE
- Fitc vs PerCP
- Fitc vs APC
- PE vs PerCP
- PE vs APC
- PerCP vs APC
Place quad stats on each plot. COMPENSATION.001 is a sample of unstained polystyrene beads. It is used to adjust the detector sensitivity on the cytometer and to allow for the placement of the quad stats.
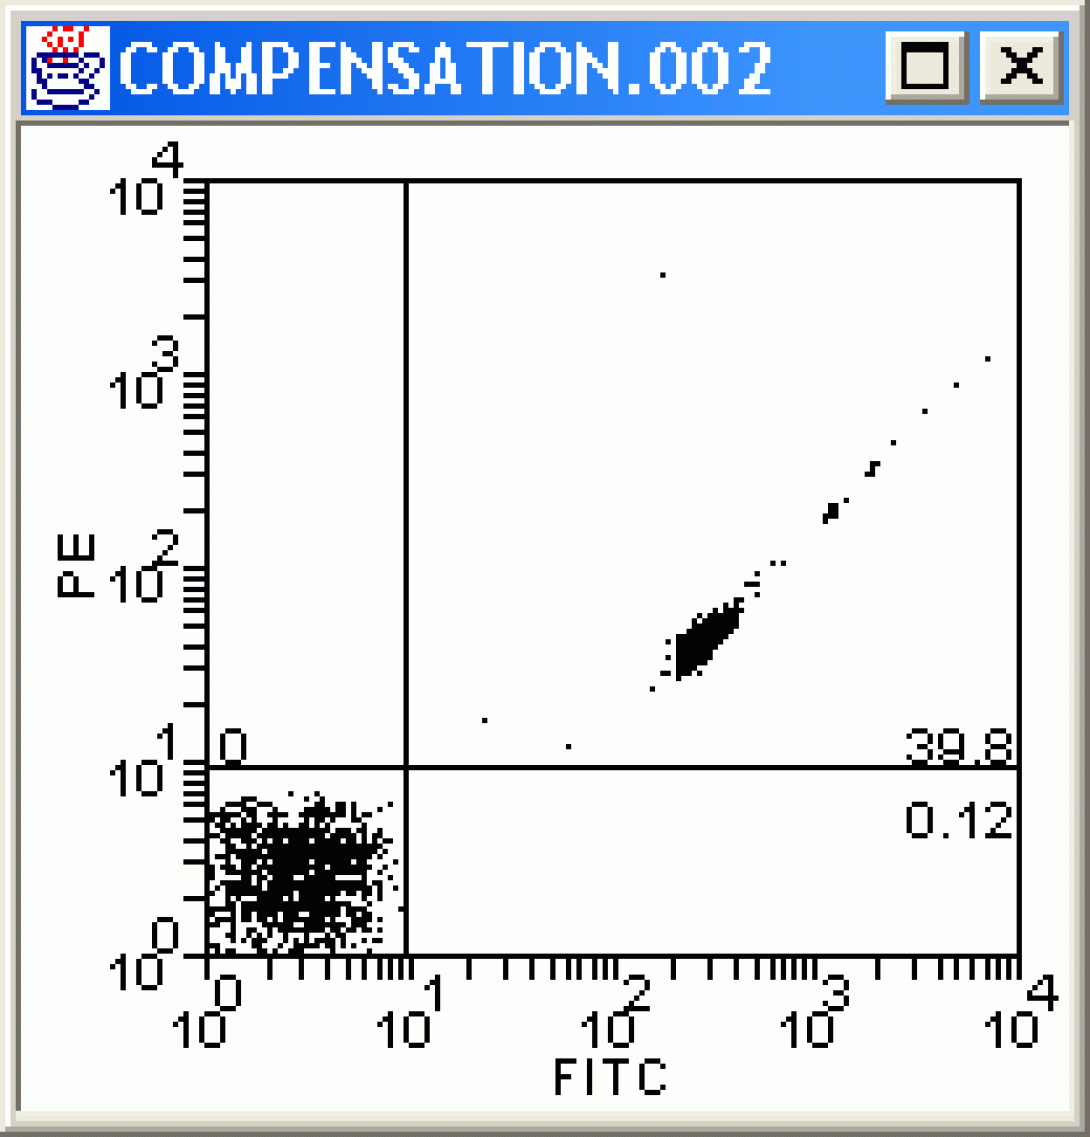
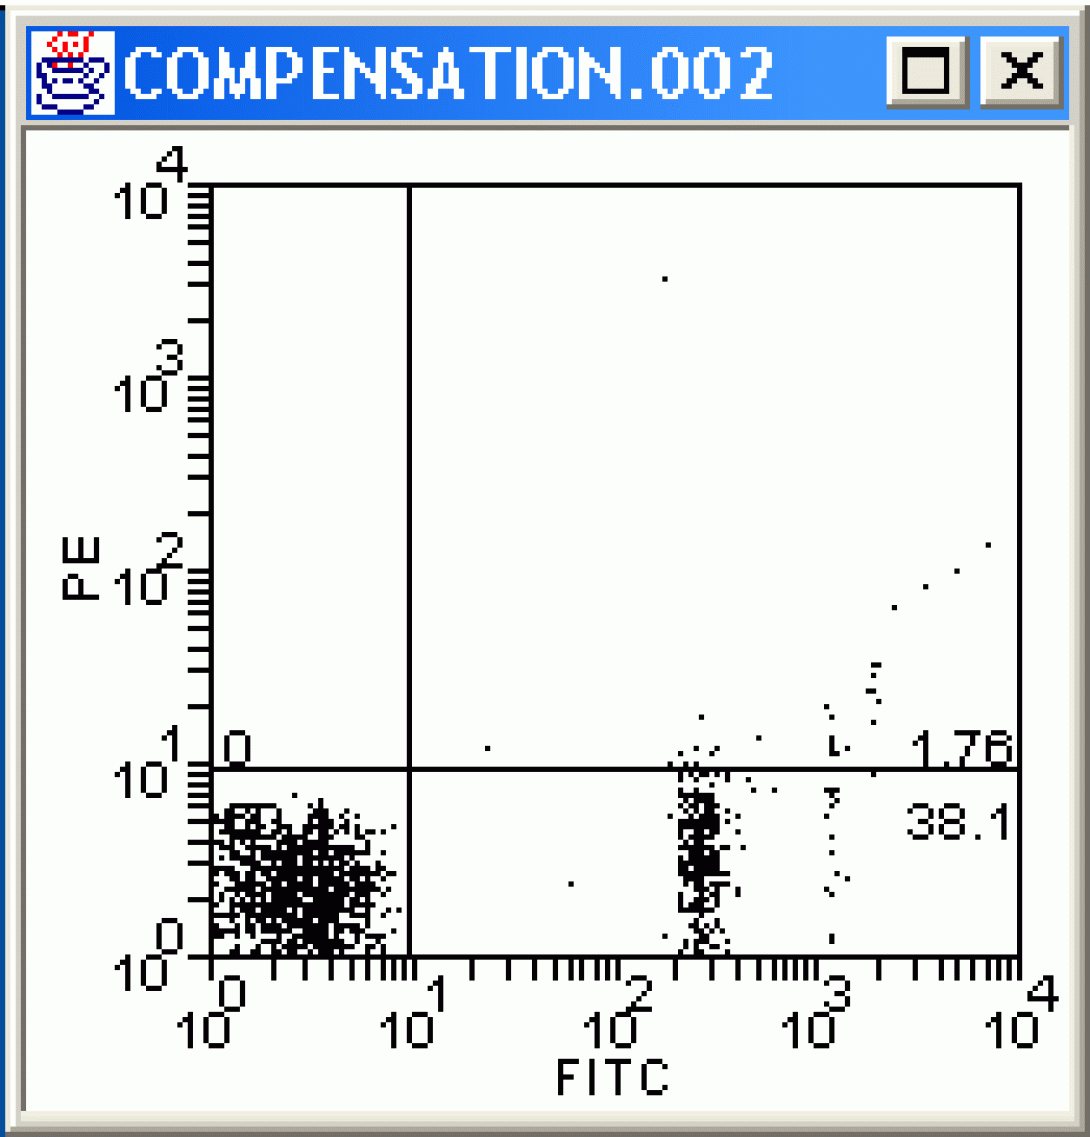
Once the stats are in place, change each plot to COMPENSATION.002. This file is a sample of negative and fitc-stained beads. Examine the dot plots carefully. What do you notice? Channels other than Fitc are showing positive events. As these are beads, we can say without doubt that these are false positives and need to be corrected for via compensation.
Right-Click in the Fitc vs PE plot and choose Compensate. The Set Spillover (Compensation) dialog opens. Enter a value for the PE -%Fitc correction (see image), and click Apply to All.
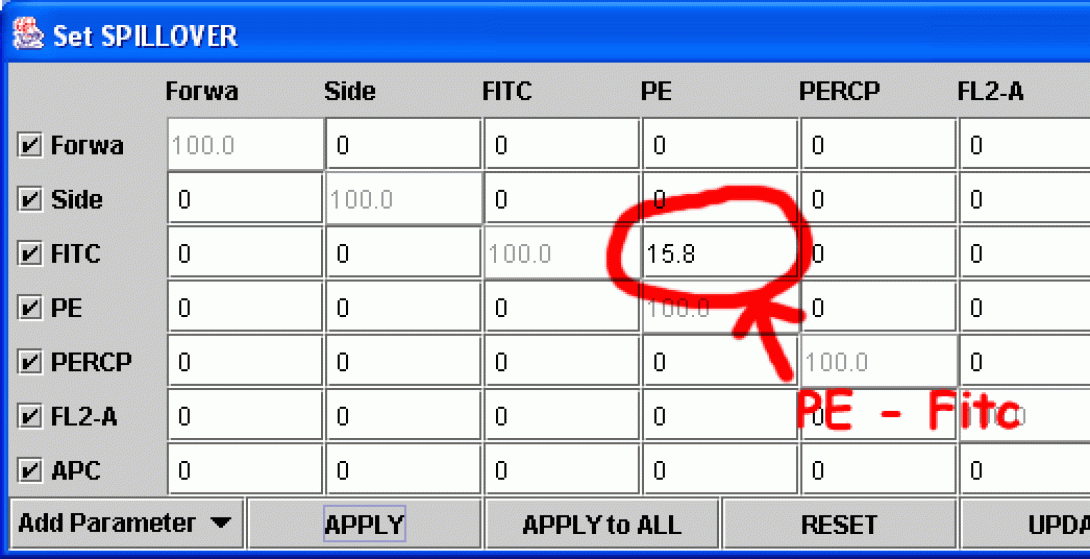
How does the image change? Continue to adjust the value until there are no more false PE positives (be careful not to overcompensate). The proper compensation level is when the mean PE value of the Fitc-negative population is equal to the Mean PE value of Fitc-Positive population. This can be done by “eyeballing” it (that would be the art) or by creating a stats window and adjusting the compensation value until the mean values for the two quadrants are equal (that would be the science). The method you choose depends on your preferences and how many colors are being used for the analysis (the more colors, the more difficult eyeballing becomes).
Wrapping Up
In order to asses your understanding of the material thus far, please email the answers to the following exercise to David Adams.
Complete the analysis of the data files. Apply compensation as needed to all channels. The COMPENSATION.001-.006 are Blank, Fitc only, PE only, PerCP only, APC only, and all beads respectively.
- What would be the benefit of reducing the bandwidth of the bandpass filters? the drawback?
- Attach a copy of your completed compensation exercise (COMPENSATION.006 – Fitc vs PE, Fitc vs PerCP, and PerCP vs APC)
Before we delve to deeply into the various applications of flow cytometry, it is best to take the time to gain an understanding of how flow cytometers work. Understanding how the data is actually produced will help you understand the why’s behind the careful design of flow cytometry experiments and what to do in case the experiment does not go as expected.

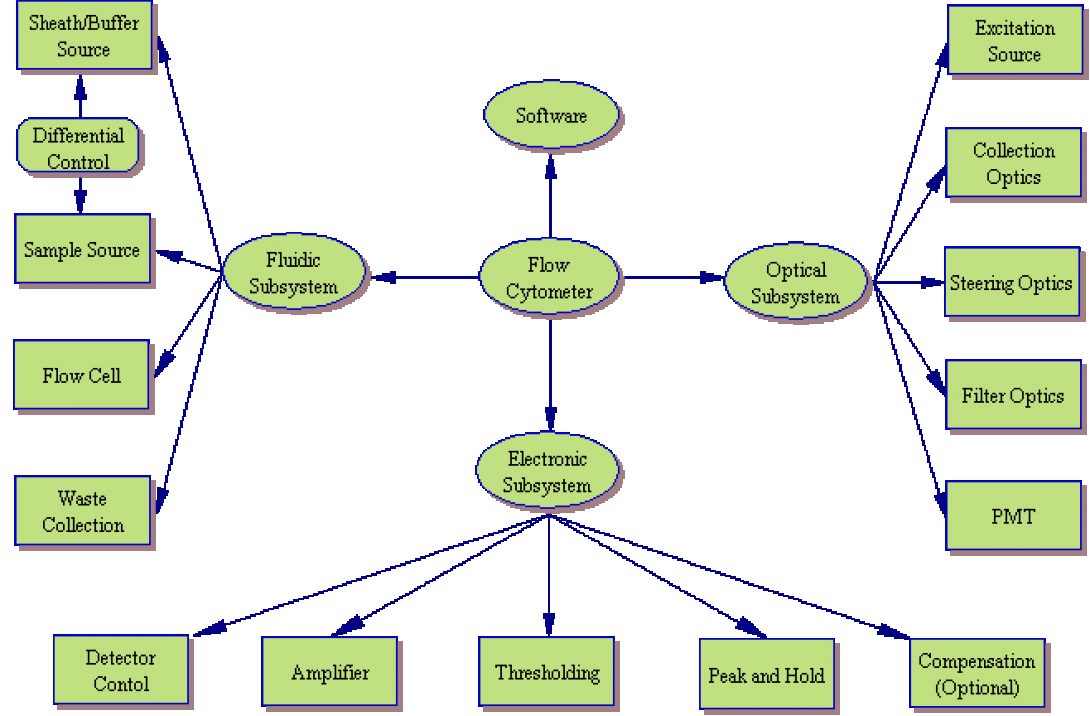
A flow cytometer, any true flow cytometer, consists of three major subsystems: fluidic, optical and electronic.
While manufacturers continue to build simpler and more efficient cytometers (such as the Gauva Technologies EasyCyte system which significantly reduces the fluidic component), they can still be broken down into the same basic subsytems. The image to the left shows a system layout of a typical cytometer. Of course, the systems are not this simplistic. The image below shows that as you begin to examine each component, the overall system shows increasing levels of complexity.
Expanded Subsystem Analysis
Wrapping Up
In order to asses your understanding of the material thus far, please email the answers to the following questions to David Adams.
- Describe, in your own words, the benefits of a closed flow cell system versus an open flow cell.
- Describe, in your own words, the meaning of the term dead time.
Electronic Subsystem

Our examination of the electronic subsystem begins with the detector. High-voltage power supplies are used to control the voltage applied to the photomultiplier tube (PMT). As stated in the optics discussion, increasing this voltage, increases the sensitivity of the PMT while decreasing voltage decreases sensitivity. As photons strike the PMT a current pulse is formed which passes from the detector to the amplifiers. These amplifiers provide a linear or logarithmic (generally user-selectable) amplification of the current pulse in order to increase the signal for easier measurement. The amplified signal then passes through a thresholding circuit.
As you can imagine, there are always stray photons striking the detector (unless the cytometer is kept in an absolutely light-fast environment, of course). This would make the identification of individual cell fluorescence impossible if not for the threshold system. In simple terms, the operator chooses a parameter (generally forward scatter) or combination of parameters (forward scatter plus fluorescence detector one) and a minimum signal level. Once the parameter(s) and signal level are selected, the threshold blocks any signal below the chosen level and only passes those events with a higher signal level than the chosen threshold.
Peak and Hold
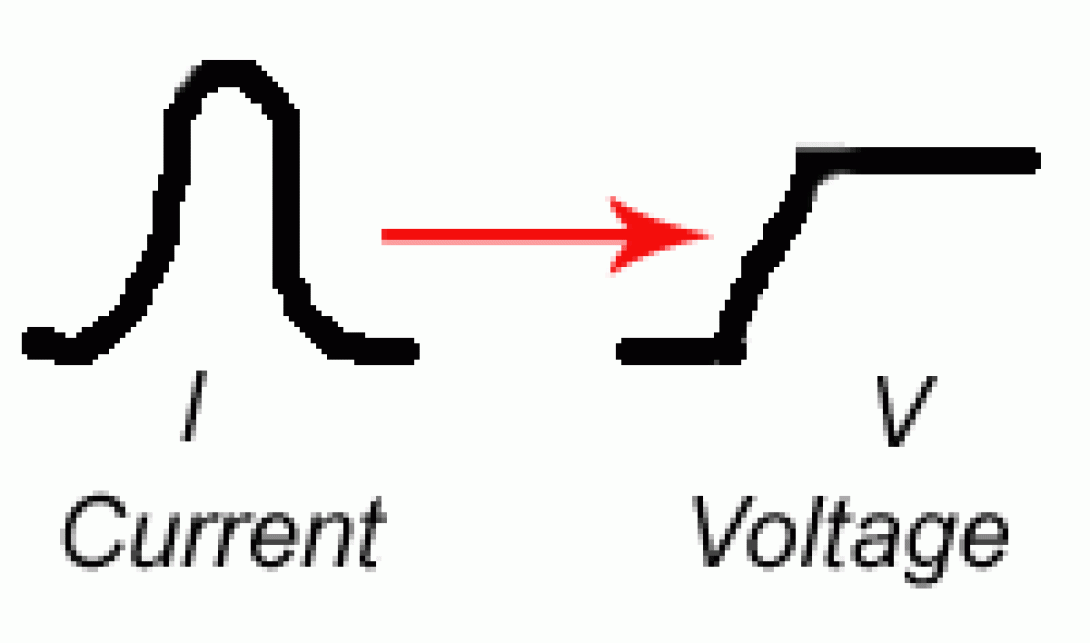
It may surprise you at this point to learn that while the system generates a current pulse, measurements are generally not made (on analog systems) of this current pulse. Rather the system performs a current to voltage conversion to produce a voltage peak from the original current signal. The reasons are myriad, but from a practical point it is easier to manipulate and measure voltage signals than current signals with analog, solid state systems.
Once a signal is converted to a peak and passes thresholding, the analog cytometer systems hold the state of the electronic system (ignoring further input) for a user-defined period of time. This period is known as the instrument dead time as the instrument will ignore any additional signals passing threshold (Note: the careful reader will realize that this dead time is another limiting factor on the maximum speed at which a sample should be injected into the flow cell). During this dead time the electronics will quantify the requested peak characteristics (maximum deviation (height), width, area) and pass the values on to the software system.
Compensation
DON’T PANIC! You will not be required to perform a Weasel analysis here!
Though the trend is increasingly for modern cytometers to perform compensation in the software, many cytometers (including the FACSVantage SE) perform compensation in the hardware. As you may recalll, compensation is simply the act of subtracting a percentage of one signal from another. Hardware compensation works in much the same way. The voltage peak to be subtracted is reduced by the appropriate factor, and the peak is inverted (producing a voltage peak of the opposite sign). This signal is added to the voltage peak of the signal to be compensated, thereby reducing the measured signal level. These modified signals are passed on to the software system.
Moving On
Once you’re comfortable with this material, please move on to the next subsytem.
Fluidic Subsystem
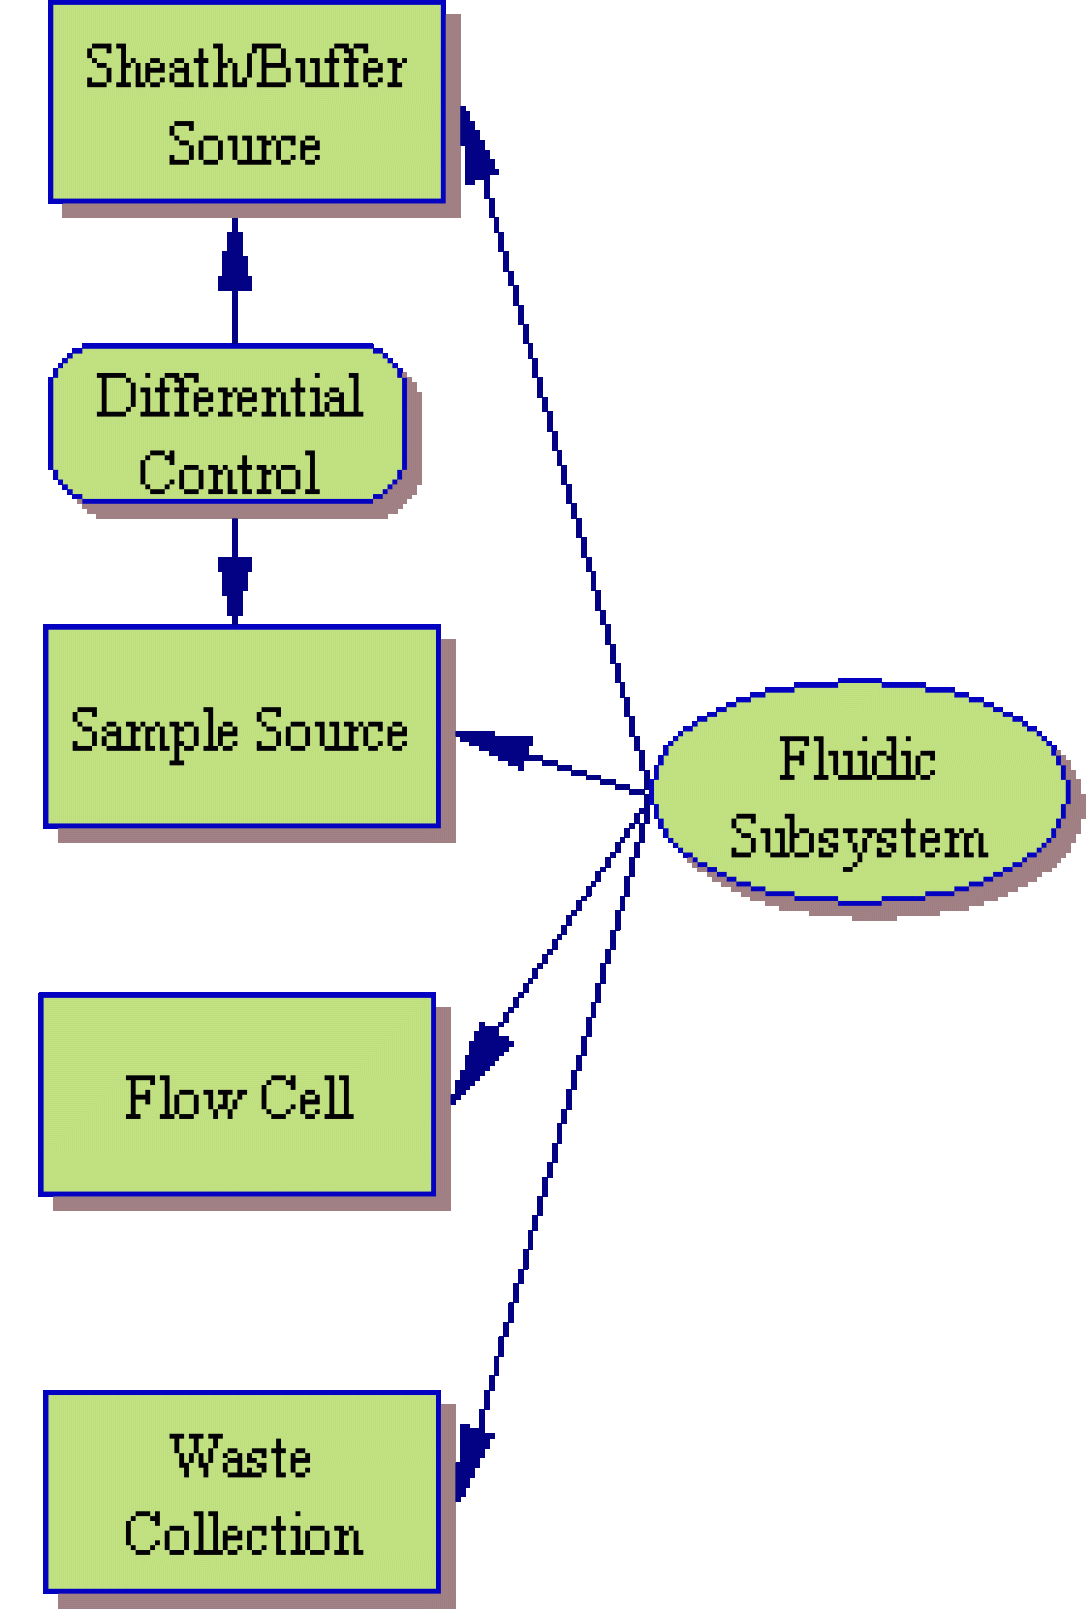
The fluidic subsystem is, perhaps, the easiest of the three hardware subsytems to understand. In essence, it consists of a sheath/buffer fluid source, the sample source itself, a flow cell and a waste collection system.
As you may recall, the sheath fluid and sample fluid are injected into the flow cell from their respective reservoirs in order to produce hydrodynamic focusing and smooth laminar flow directing the cells, single file, through the flow cell. This injection can be achieved in any number of ways, but a classic cytometer will use air pressure and a differential control system
In a differential control system, air is pumped into the sheath reservoir at a controlled pressure (let’s say 13psi). When the fluidic lines are open, this pressure will push the sheath through the system at a steady rate. In order to move the sample fluid, the air source is split and the sample pressure line is directed through a biasing relay or differential valve. This differential will reduce the air pressure by a small fraction before pressurizing the sample chamber. (Note: the fluid dynamics of the flow cell allows the sample injection to occur even when the sample pressure is lower than the surrounding sheath pressure). Controlling the sample flow rate, then, is simply a matter of controlling the amount of pressure reduction over the sample. Too much reduction will, of course, result in loss of sample flow and, in extreme cases, back flow of the sheath fluid into the sample lines. Too little reduction will result in an expanded center stream with poor focusing characteristics.
Typical Flow Cells
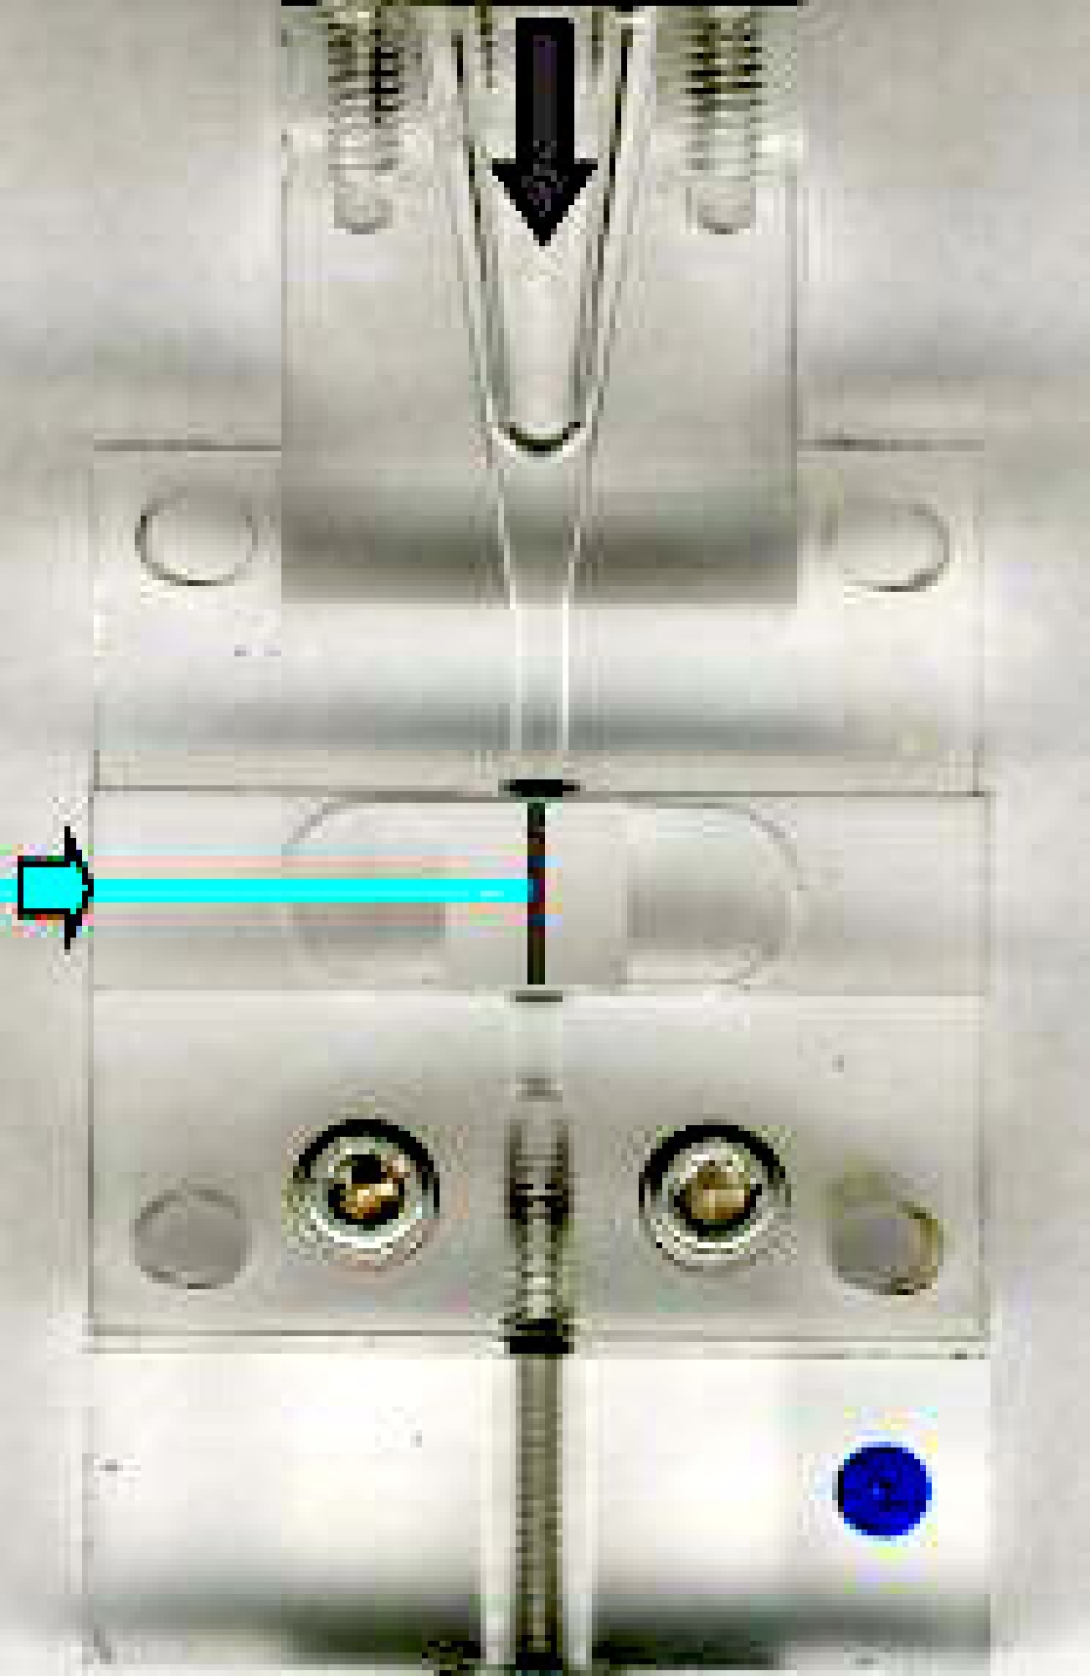
This image shows a typical stream-in-air flow cell. As you can see, hydrodynamic focusing occurs within the flow cell, but inspection of the cell (the laser/stream interface) occurs outside of the flow cell in free space. These flow cells are well-suited to cell sorting applications but suffer due to lower sensitivity compared to closed systems.
This image shows a typical closed, or cuvette, flow cell. It is, in fact, the flow cell from a Beckman-Coulter FC-500 desktop analyzer. As you can see hydrodynamic focusing occurs within the conical section of the flow cell. However, in this case, the fluid stream is not released in free space. Rather, the flow cell extends into an optical cuvette, and it is within this cuvette that inspection of the cell occurs. This cuvette is designed to minimize loss of excitation and emission photons and to direct the emitted light to the collection optics. As can be expected, these systems provide improved sensitivity over stream-in-air systems, but are not well-suited to the droplet formation required for electrostatic cell sorting (with, perhaps, the notable exception of the flow cell as utilized in the BDBiosciences FACSAria Cell Sorter).
The Final Step
After inspection, the cells are directed to their final destination. In an analyzer, the entire stream is sent to a waste tank for disposal. In a cell sorter, droplets containing the desired cells are diverted to an appropriate collection receptacle with the remainder of the the stream fluid being diverted to a waste tank for disposal. In the earliest cell sorters, this waste tank was often a beaker or flask sitting beneath the flow cell!
Moving On
Once you’re comfortable with this material, please move on to the next subsystem.
Optical Subsystem
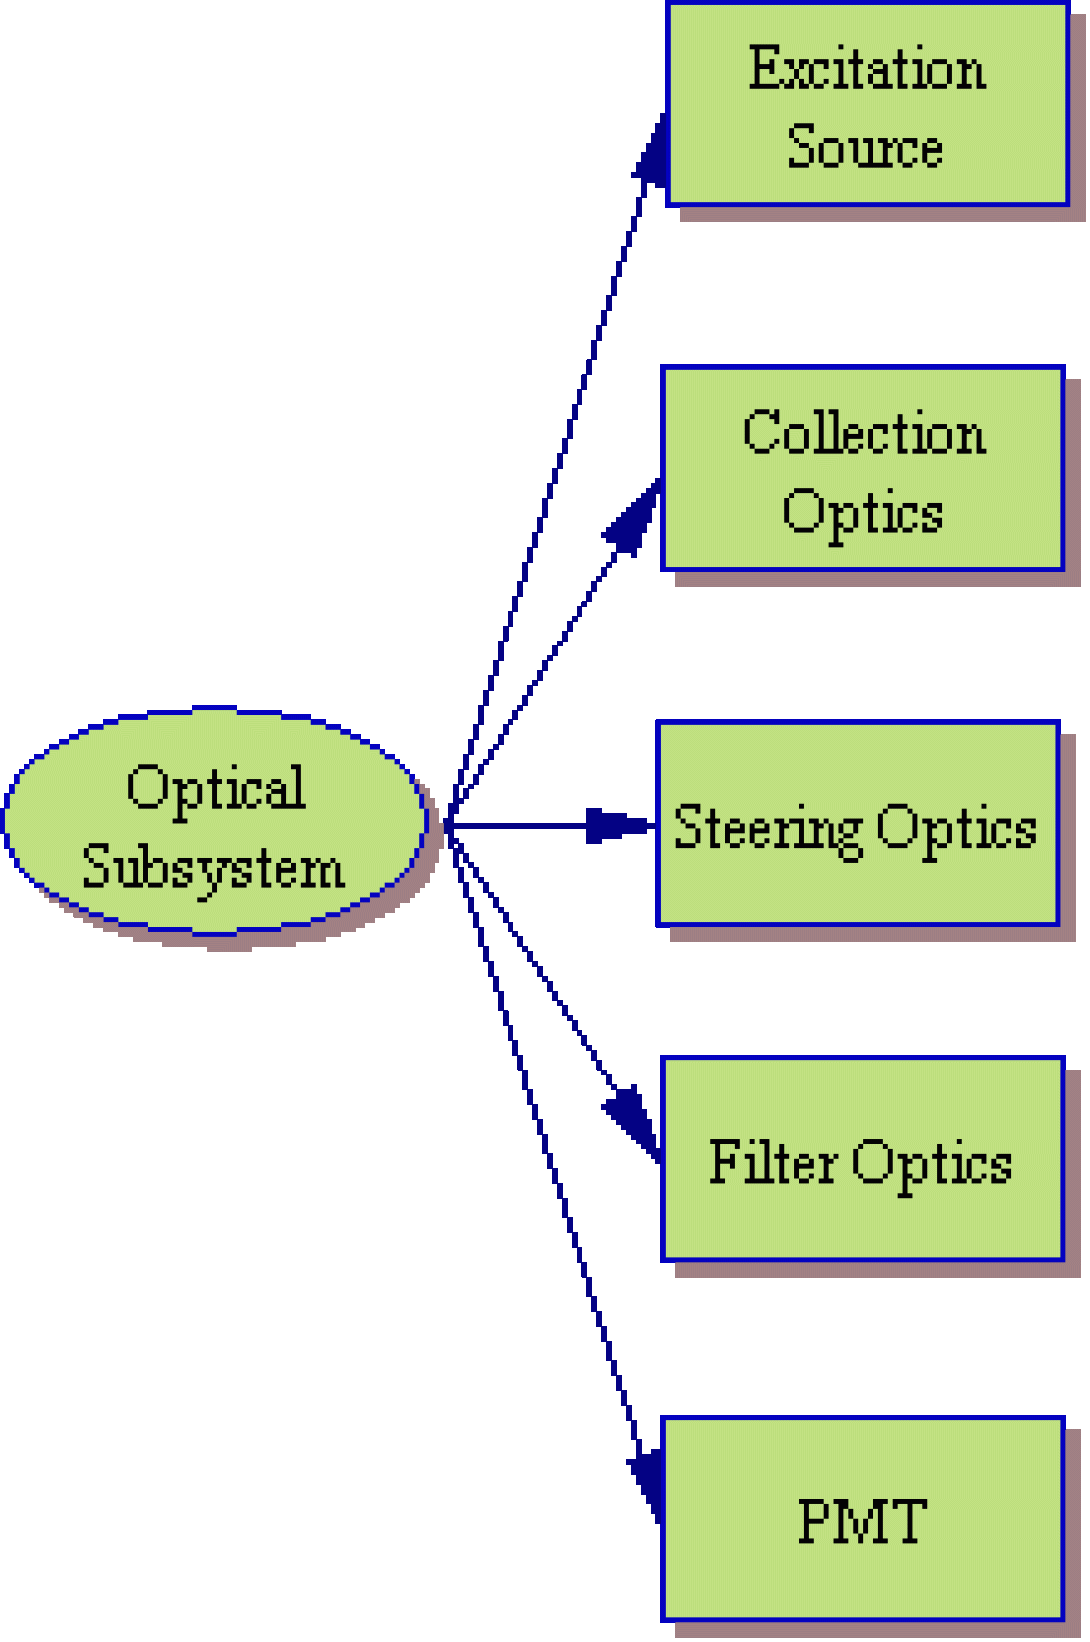
The optical subsystem of a flow cytometer is somewhat more complex than the fluidic system. The optical system begins at the excitation source. The most excitation sources used in modern flow cytometers are lasers and arc lamps. Choice of an arc lamp or laser will depend upon application as both systems have their pros and cons.
Lasers as Excitation Sources
Pros
- Narrow Wavelength Range
- Polarized/Coherent Light
- High Power Density
Cons
- Inefficient (Power In/Power Out)
- Often Requires Non-standard Utility Requirements
- Expensive
Arc Lamps as Excitation Sources
Pros
- Inexpensive
- Wide Wavelegnth Range (Frequency-Agile)
Cons
- Wide Bandwidth
- Lower Power Density
- Unfocussed Emission
Directing Light
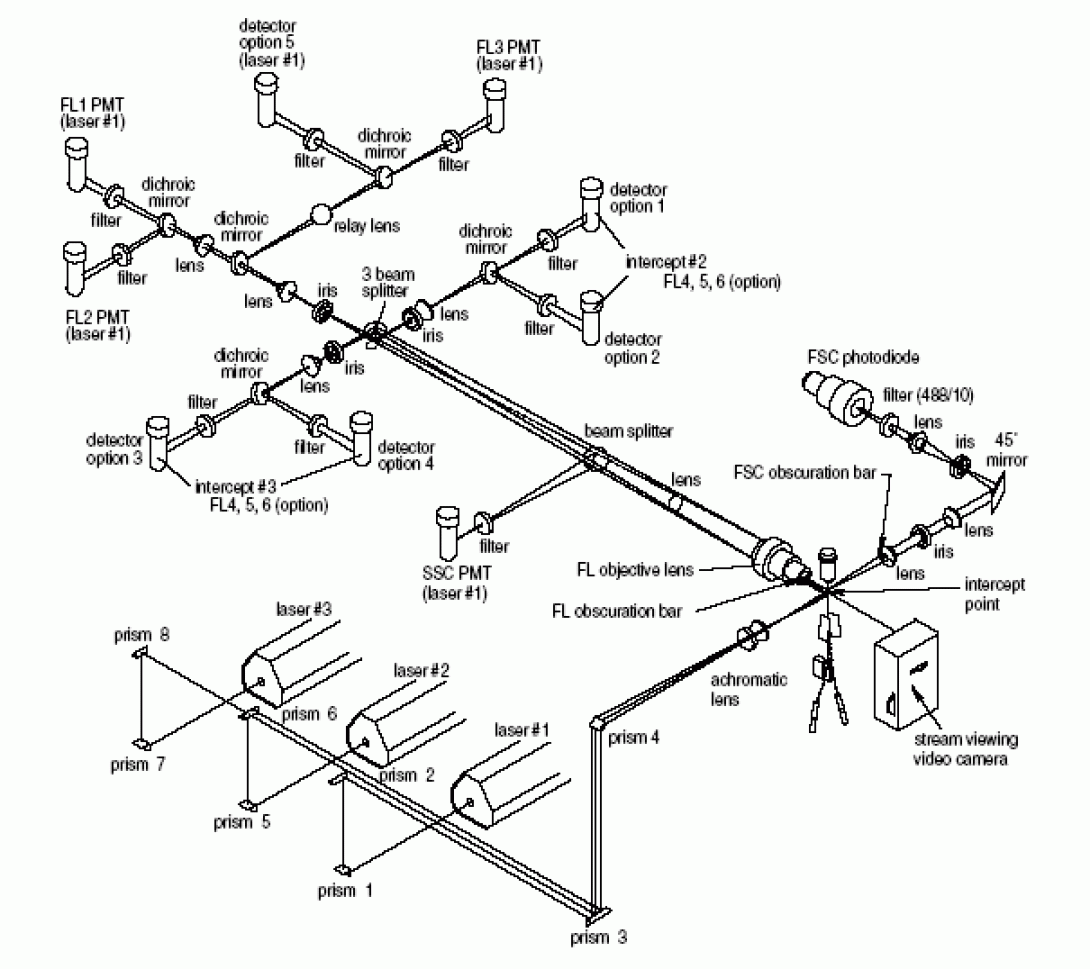
After the excitation light source strikes the stream, fluorescent molecules attached to, or incorporated within, the cells emit higher-wavelength photons. A wide-angle collection optic (often something as simple as a microscope objective) is placed near the flow cell to collect these photons and focus them into the cytometer detector path. Contained within the detector path are a combination of steering optics (prisms, beam splitters and dichroic mirrors) and bandpass filters. The figure below details the optical bench of the BDBiosciences FACSCalibur.
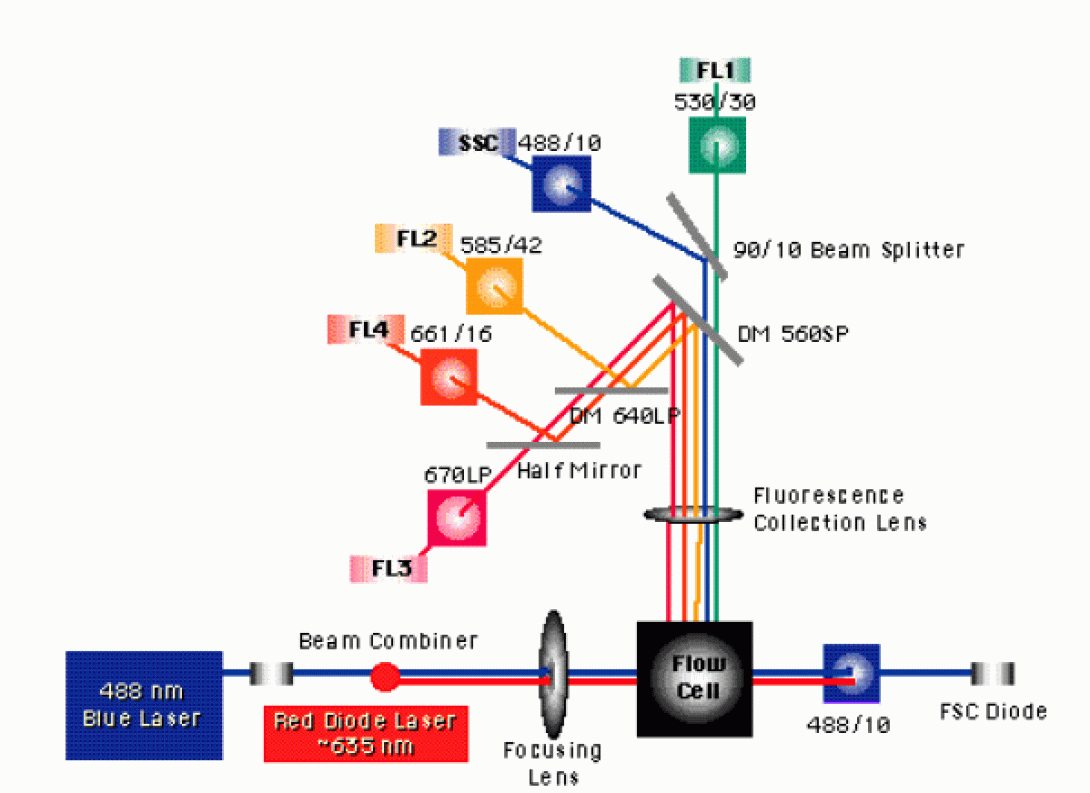
Notice the notation for the bandpass filters in front of the SSC, FL1, FL2 and FL4 detector. The FL1 filter is labeled as 530/30. This indicates that the filter will has a 30nm bandpass centered on 530nm. Therefore, light ranging from 515nm to 545nm will pass through this filter without reflection or absorption. Notice also, that the FL3 detector does not have a bandpass filter, but rather a 670nm long pass filter. As you have probably guessed, this means that the filter will pass any photons that have a wavelength of 670nm or above. Why might the manufacturers have chosen to place a long pass filter here rather than the standard bandpass?
The FACSCalibur uses a spatially-separated laser system. This means that the two laser beams are not brought in a collinear fashion but, instead, are separated in time and space. This separation enables system to accurately measure fluorochromes with very similar emission spectra without the concerns of significant overlap.
A somewhat more complex optical layout is pictured below. This is the FACSVantage SE optical deck. Notice that the system is able to utilize three spatially separated lasers. Be aware that while the system contains eight fluorescent detectors, the FACSVantage SE is only capable of using six of these detectors simultaneously (plus the two scatter detectors) without significant modification of the digital upgrade option. The core facility has three of these sorters available for your use.
The Final Step
After steering and selection (via the bandpass filters), the final step in the optical system is detection. This is generally accomplished with photomultiplier tubes and/or photodiodes.
The photomultiplier tube, or PMT, operates via an electron cascade. That is, a PMT contains a series of charged grids. When a photon strikes the outer grid, a number of electrons (e-) are released. These electrons strike the next grid in the series releasing further electrons. This continues throughout the series of charged grids until the last grid at which point the electrons are collected and a current pulse passes from the detector. The amount of electrons released by each grid strike can be controlled by increasing or decreasing the voltage applied to the grids. Therefore, raising the voltage applied to the detector increases the sensitivity of the PMT while decreasing the voltage lowers the sensitivity. Photodiodes work by a different, though quite interesting mechanism, but for our purposes, you can consider them solid state equivalents of the PMT.
When people think of flow cytometry, they are generally thinking of an immunofluorescence technique. The binding of fluorescent molecules to cell membranes via antibody conjugation is the most widely used technique in cytometry today.
Cluster Designation
Before discussing antibody conjugation, it is necessary to discuss the general naming of antibodies. In days previous, individual researchers would identify and report on what they thought were novel cell surface antigens. As more an more antigens were discovered and reported on, however, it began to become apparent that many researchers, working independently, were reporting on the same novel antigens. In order to reduce confusion and replication of effort, an international body was formed and to organize antibody labeling, resulting in the Workshops on International Human Leukocyte Differentiation Antigens. (Similar workshops are held for other species-specific antigen labeling)
Via these workshops the antigen cluster designation system was adopted. Each identified antigen is given an official designation, or CD number. A simple cluster designation table can be seen here. As new antigens are identified they are given a temporary CDw (working) number until the next workshop is held for official adoption.
Antibody Conjugation
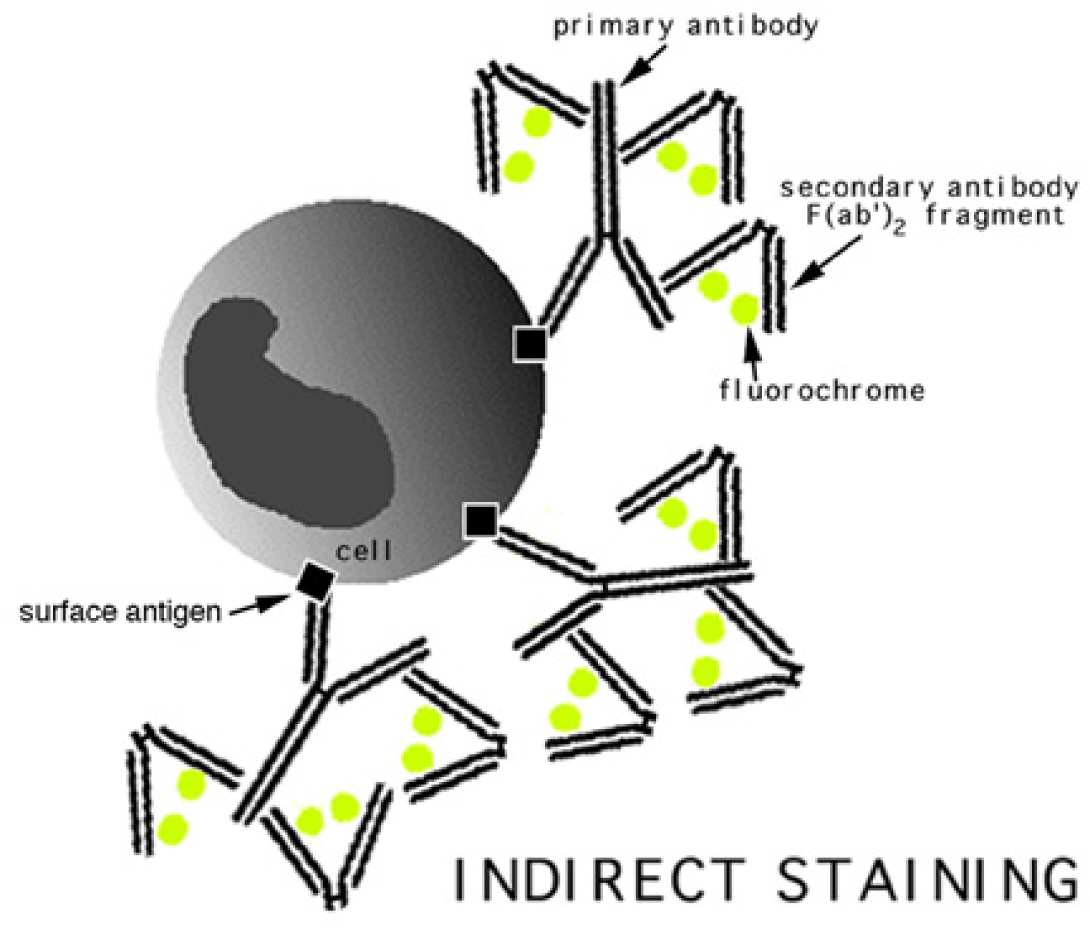
Antibody conjugation is actually a very simple technique. A typical cell membrane presents a variety of surface antigens. The presence of these antigens, or the lack thereof, relates directly to cellular function. For instance, monocytes are known to present the CD14 antigen on their membrane. Fluorochromes, coupled with an anti-CD14 antibody, can be attached to the cell via this antigen/antibody bond for easy detection. This is known, simply, as direct staining.
The image to the left shows an indirect staining method. In this case, the antibody which attaches to the cellular antigens does not contain a fluorochrome. After staining with this initial antibody, a secondary antibody or other fluorochrome-bearing molecule is introduced which binds specifically to the primary antibody. A popular indirect combination is the biotin/streptavidin pair. In this methodology, one takes advantage of the strong affinity between these two molecules by utilizing a biotinylated primary antibody, and a fluorochrome-labelled streptavidin molecule as a secondary.
Fluorochromes
Not much need be said at this point regarding fluorochromes. For those that would like a brief reminder on the physics behind fluorescent molecules, Molecular Expressions provides a useful tutorial. (Please bare in mind that this this tutorial relates to applications in microscopy. Therefore, discussions of filter methodology do not entirely apply to the world of flow cytometry).
For our purposes, it is necessary to know two characteristics of a fluorochrome. The excitation and emission spectra. The excitation spectra is necessary to know in order to determine what laser is required to excite the fluorochrome. Many manufacturers will list a fluorochromes peak excitation wavelength. While this lists the wavelength of maximum photon absorption (which is quite useful for microscopists), it is somewhat deceptive as the laser sources used on a typical cytometer have a very high power density, and do not require 100% absorption to provide a good fluorescent response. Knowledge of the emission spectra is, obviously, necessary in order to determine the appropriate detector/filter combinations and to assure minimal spectral overlap in multi-color experiments.
A table of popular fluorochromes may be found here. BDBiosciences provides a java applet which is very useful when determining which fluorochromes to use. When planning experiments, be aware that the FACSCalibur is a two laser system (488nm and 635nm).
Wrapping Up
In order to asses your understanding of the material thus far, please email the answers to the following exercise to David Adams.
You are asked to decide on a three-color T and B cell enumeration technique. In your email, include the following information:
- Three antibodies chosen
- Three fluorochromes chosen
- The laser(s) wavelengths necessary to excite the chosen fluorochromes
Beyond immunofluorescence, cell cycle studies are another popular flow cytometetric technique.
The Circle of Life
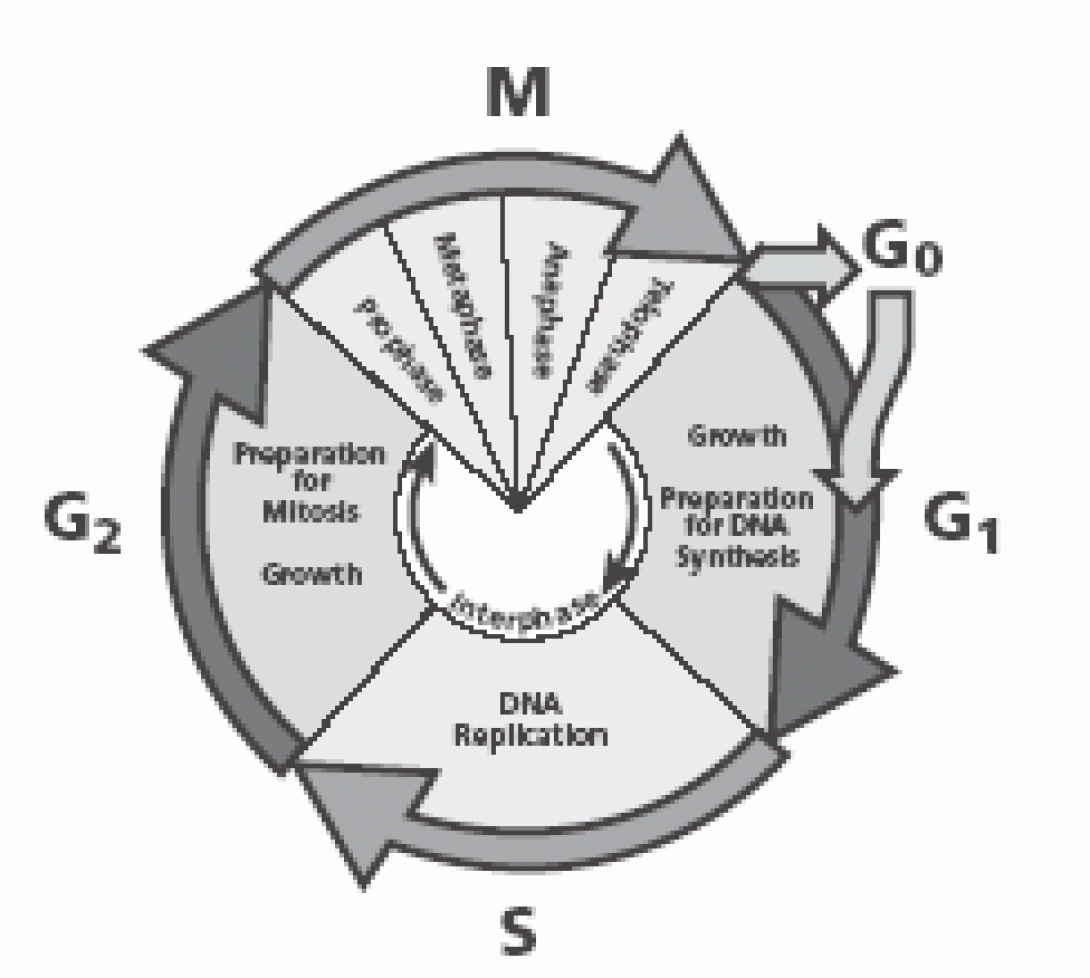
Cellular division, or cell cycling, occurs in two distinct phases, Interphase and Mitosis. Interphase consists of the G1, S and G2 phases:
- G1 – Cell are active and growing. Cells are receptive to signals to begin DNA synthesis
- S – Cells are actively replicating DNA
- G2 – Cells are actively preparing for mitosis. Cells contain twice the normal amount of DNA
Mitosis occurs in the M phase in a four-step process (prophase, metaphase, anaphase, telophase) which results in cell division and normal dna content.
G0 is a somewhat controversial stage as some investigators do not believe that it truly exists. Cells in G0 have exited mitosis and are quiescent. These resting cells may be reactivated and enter the G1 phase upon receipt of the appropriate stimuli.
Propidium Iodide Staining
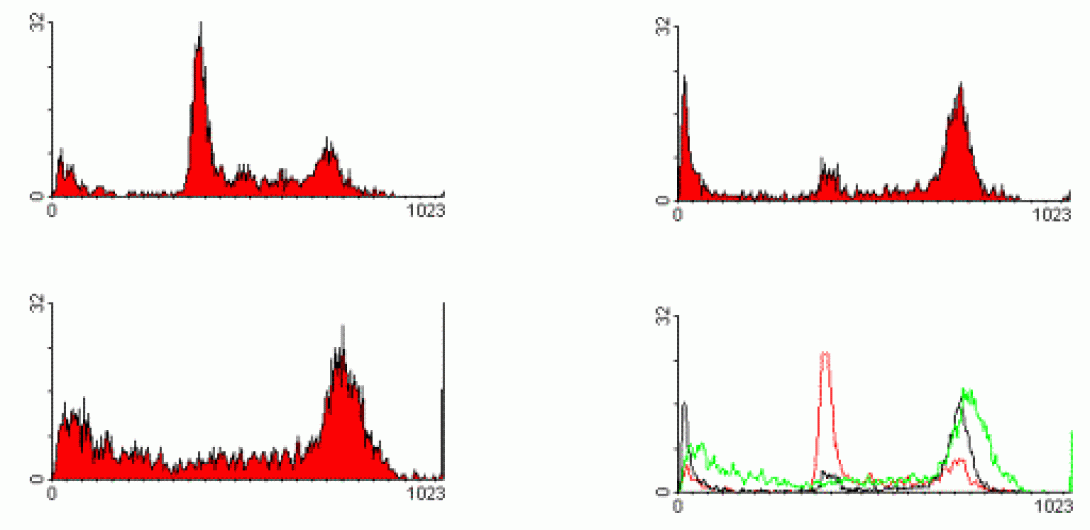
Propidium Iodide is a typical cell cycle stain. The dye passes through a permeabilized membrane and intercalates into cellular DNA.The intensity of the PI signal, then, is directly proportional to DNA content. In the above image, we see three different examples of cell cycle analysis. In the first image (upper left), we see a typical cellular state with the majority of cells in the G0/G1 phase (tallest peak). The rightmost peak on the histogram shows the cells in the G2/M state. The area -between these peaks indicates cells within S-phase. The following two histograms show the cells after various drug treatments. The upper-right image shows the cells being arrested in G2. The lower-left histogram shows a marked increase in apoptosis as indicated by the substantial decrease in DNA content (those events showing sub-G0 DNA content). The lower-right histogram shows an overlay of the three histrograms in these states.
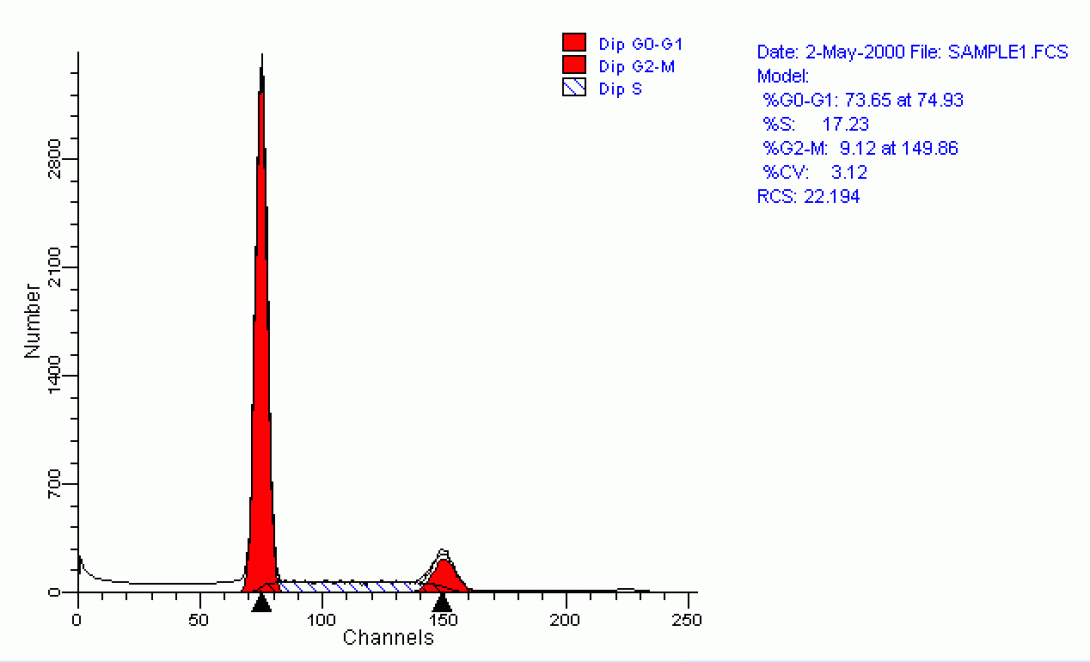
As you can probably imagine, it can be very difficult to determine quantitative measurements of each of the cell cycle phases by simple gating-analysis of the cytometric data (Here are some data files if you care to give it a try). A better approach is to use a modelling program. The Flow Core’s FACSCalibur is equipped with Verity Software House’s Modfit LT. This program, and others like it, utilizes peak fitting techniques to automatically model the pi data and provides the desired quantitative data. Each iteration also provides a statistical analysis of the modelling effort to provide an indication of accuracy. A typical such modelling can be seen below.
Staining Techniques
For your convenience, we have placed two common Cell Cycle staining protocols on the core web site. The first is a simple ethanol-fixation technique. This protocol produces excellent results and is the most often used amongst flow core clientele. The second, involves a hypotonic lysis of the cell so that free nuclei are analyzed. This procedure can also produce good results and should be considered if you experience problems with the fixation technique.
BRDU
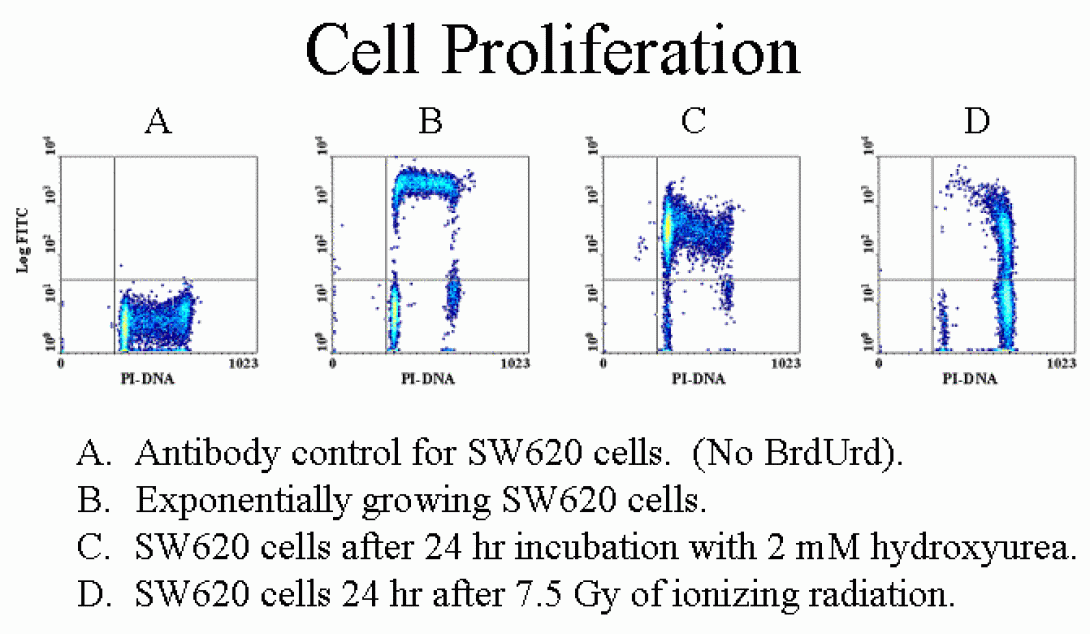
While PI staining provides a very precise image of the cellular state with regards to cell cycle, it really provides no information regarding the kinetics of cell cycle. BRDU staining is a popular method for beginning to look at the kinetics of the situation. Bromodeoxy-uridine (BRDU) is similar to the DNA precusor, thymidine. During S-phase, in the presence of BRDU, the cells with incorporate BRDU during the S-phase. After a targetted incubation period, fluorescently-labelled antibodies specific to BRDU can be added to provide an indication of which cells have entered the cell cycle during the incubation period. This technique is often used with PI staining in order to provide a clearer image of cell cycle. The image above shows cells labelled with PI and BRDU-Fitc.
Staining Techniques
For your convenience, we have placed a BRDU staining protocol in this folder. This procedure produces excellent results, but be aware that careful attention must be paid to titrations and incubation times.
Wrapping Up
In order to asses your understanding of the material thus far, please email the answer to the following exercise to David Adams.
- We have focused on Propidium Iodide in this discussion. Do a web search a find two other cell cycle stains. Comment upon their relative benefits or drawbacks compared to PI (viability, CVs, etc).
As discussed in Lesson 6, PI and BRDU staining provide detailed information regarding cellular state but very limited information regarding the kinetics of the cell cycle. CFSE provides significantly greater kinetic information.
CFSE – The Cell Division Maker
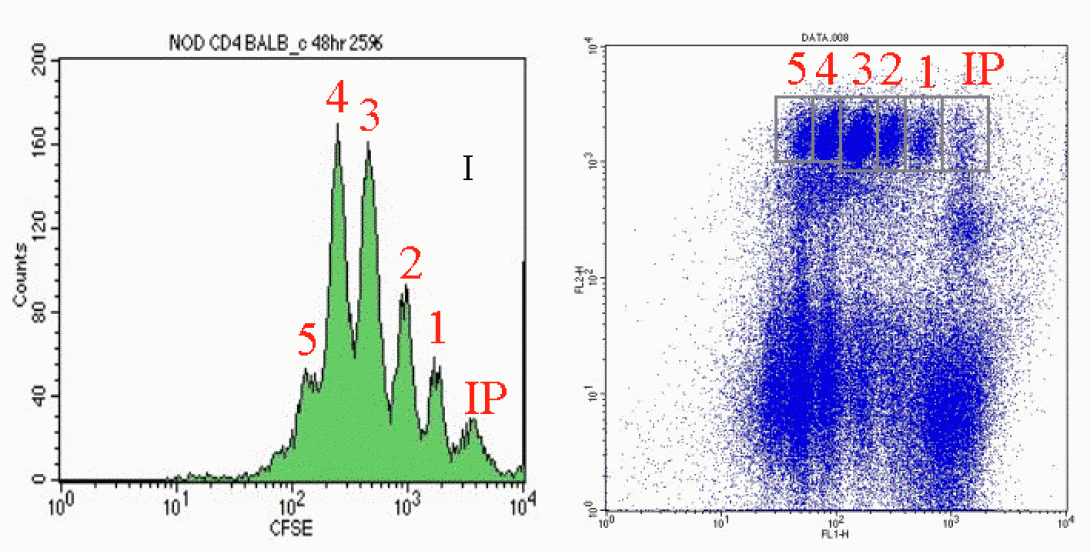
CarboxyFluoroscein Succinimidyl Ester, or CFSE, is a vital stain which is, generally, not harmful to cells. Upon entering cells, it undergoes esterase cleavage and diffuses throughout the cytoplasm. As cells divide, the CFSE is split equally between the daughter cells resulting in diminished CFSE signal detection. This division, and resultant signal diminishment occurs with each subsequent cell division. This technique is useful both in vivo and in vitro. The in vivo technique is particularly interesting in that it allows for the harvesting and staining of cells with CFSE followed by the injection of treated cells back into the animal. The cells can then be reharvested at a later date and analyzed for CFSE to indicate how many divisions have occurred in a given time frame. Such analysis are often coupled with drug treatment studies to see how treatment affects the frequency of cell division.
In the images above, you can see an example of CFSE analysis via manual gating. Notice in both images, the Initial Population (IP) is the brightest population with each resulting cell division (1-5) showing reduced CFSE signal. Notice also, that the CFSE analysis shown is of a sub-population of cells as identified by PE counterstaining with a selected antibody.
Peak Fitting
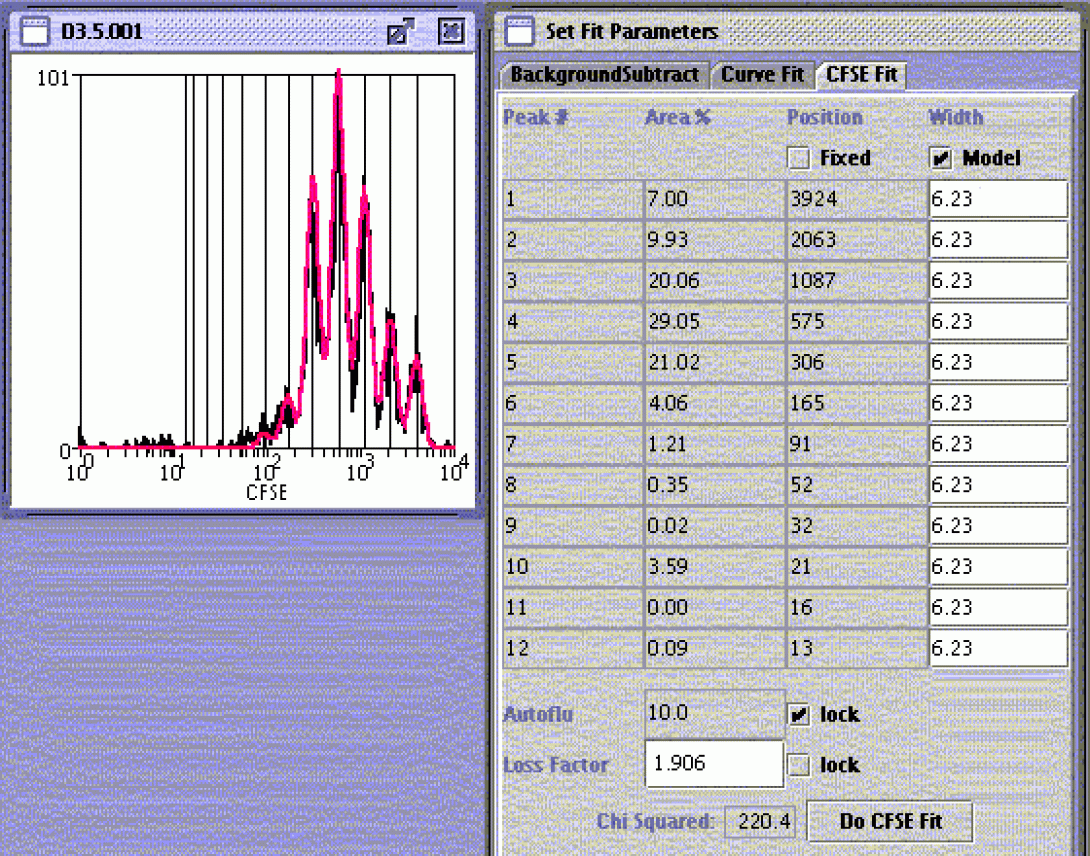
In cases where the investigator needs to know not only the number of divisions but also the frequency of cells in each division state, manual gating can be of limited utility due to peak overlap. As with PI and cell cycle, this method tends to produce qualitative rather than quantitative data. When higher accuracy is desired, it is often necessary to use a peak-fitting algorithm. Peak-fitting applies mathematical modeling to the histogram and produces a quantitative analysis, again complete with internal statistical analysis. Many cytometry packages, such as Weasel (with which we are all familiar), FlowJo and Modfit, include peak-fitting routines. The above image shows a Weasel-based analysis. The instructions for this analysis can be found in the Weasel Help file.
Wrapping Up
In order to asses your understanding of the material thus far, please email the answers to the following exercise to David Adams.
Practice analyzing the CFSE (FL1 axis) with these data files. As with the above example these cells are counterstained in the PE channel (FL2 axis). Choose a data file and tabulate your results. Be sure to include the method of analysis (curve fitting or manual gating), why you chose the method of analysis, the software used for the analysis, and your overall impressions of the technique. If you have trouble with the an analysis, proceed to Lesson 7.1.
Special thanks to Sean Linkes for providing the CFSE data and graphics. Sean may be reached at the Flow Cytometry Core Main Facility.
Here is a more detailed look at the cfse analysis procedure discussed in lesson 7.
CFSE – Where to begin
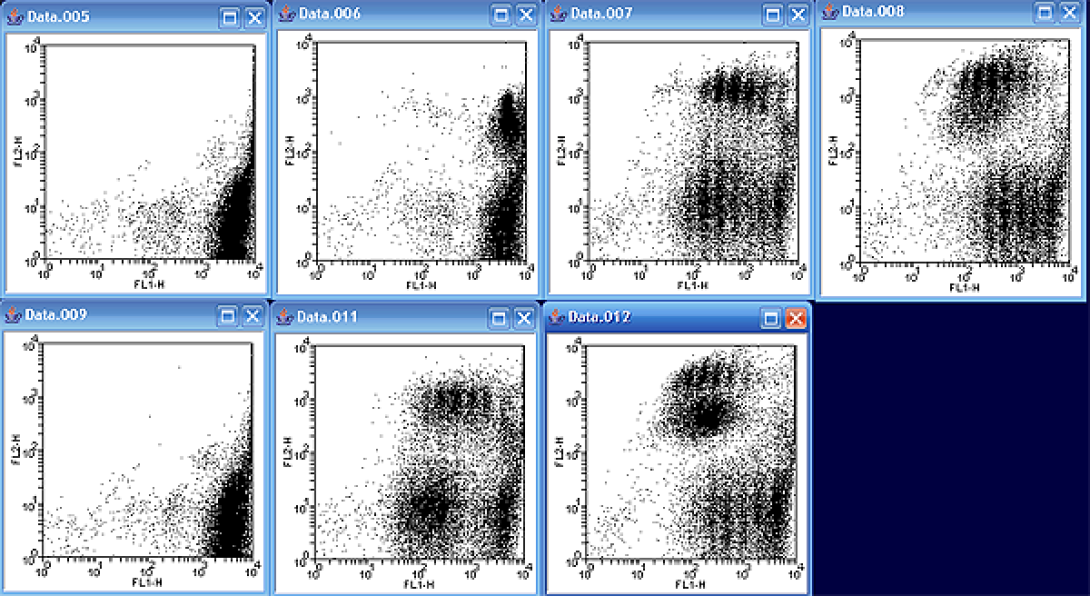
A good first step prior to attempting a curve fit is to take a look at all of the data files together in order to determine which file to analyze. As mentioned in the lesson, the samples are counterstained with PE, so I will display FL1 (CFSE) versus FL2 (PE) as per the example. While it may not have seemed obvious looking at the files individually, the data files actually represent two sets of time courses. Files 005 – 008 represent one time course, while files 009-012 represent another.
Looking at the first series, notice how there is only one significant cfse peak in the image. As time moves on, more and more “peaks” start to appear. Notice also, that the newer peaks appear lower on the FL1 axis due to the fact that the CFSE stain contained in the parent cell is split between the daughter cells; in other words, the newest cells have the lowest CFSE staining. Notice also that the PE positive and PE negative populations have slightly different kinetics with different relative distributions between each division.
Curve Fitting
Let’s first take a look at the automated curve fit method in Weasel. For this example, I’ve chosen to look at file #11. As the instructions indicated PE counterstaining, I will first create a region around the PE-postitive events as in the image aboce. I will call my region PE Pos.
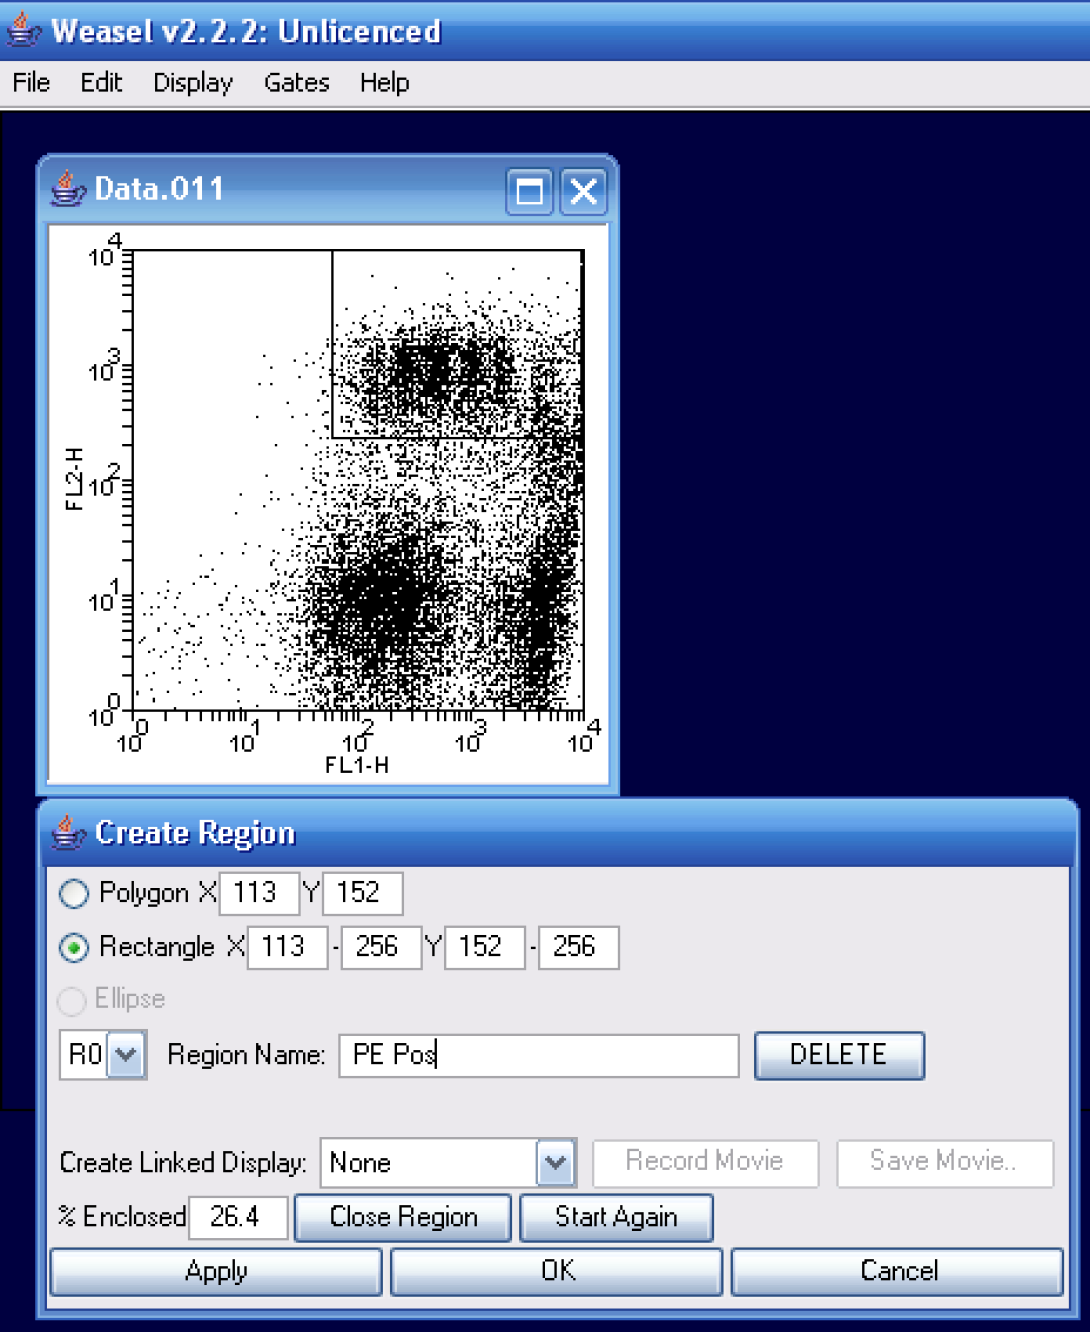
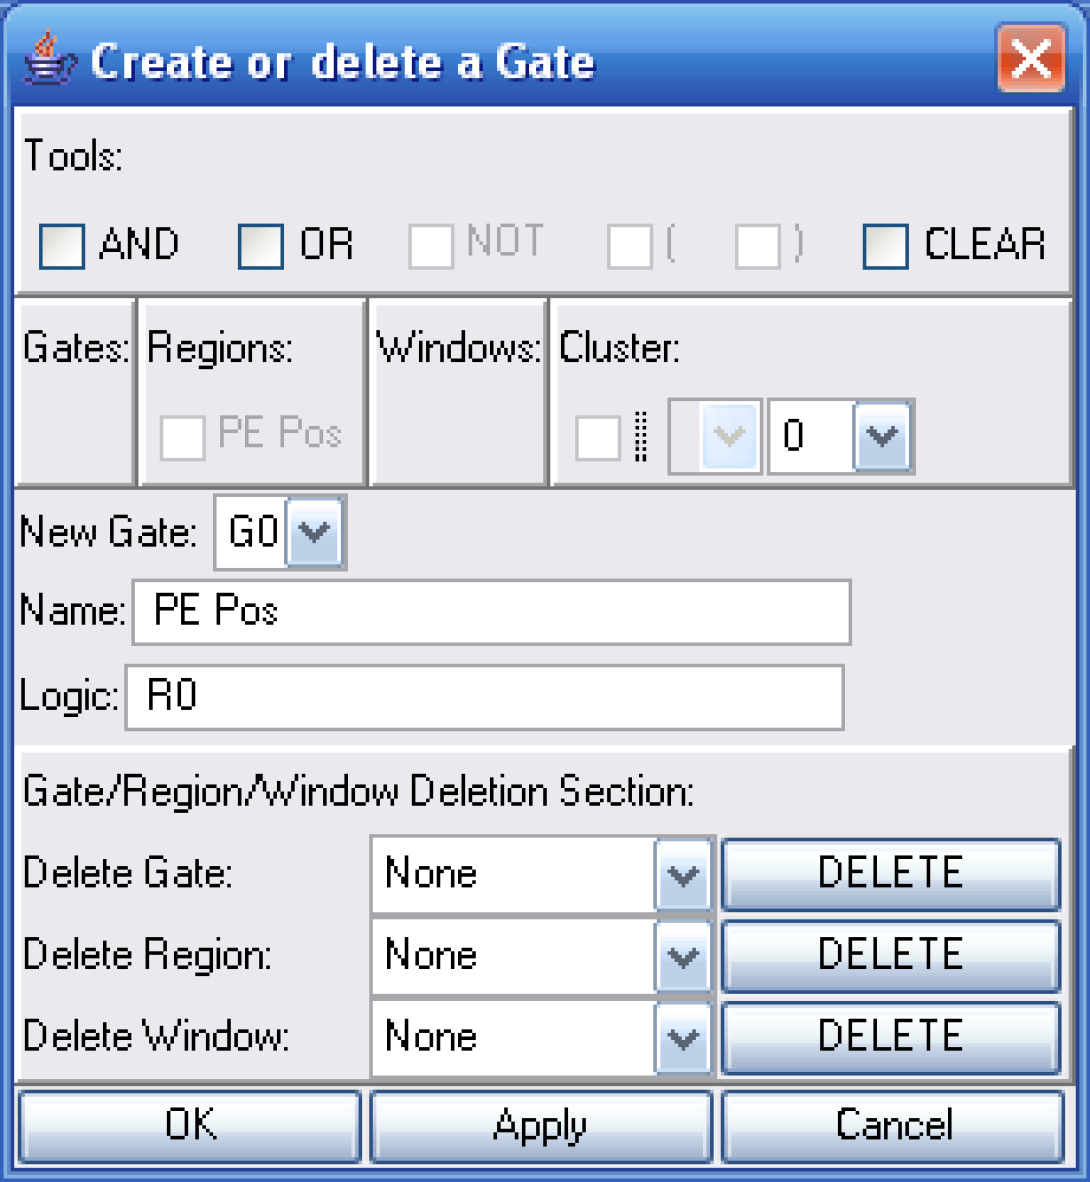
I will then convert my region into a gate using the create gate option.
The next step is to create a New Histogram. Notice how I have chosen only to show the FL1 data and that the PE Pos gate is selected.
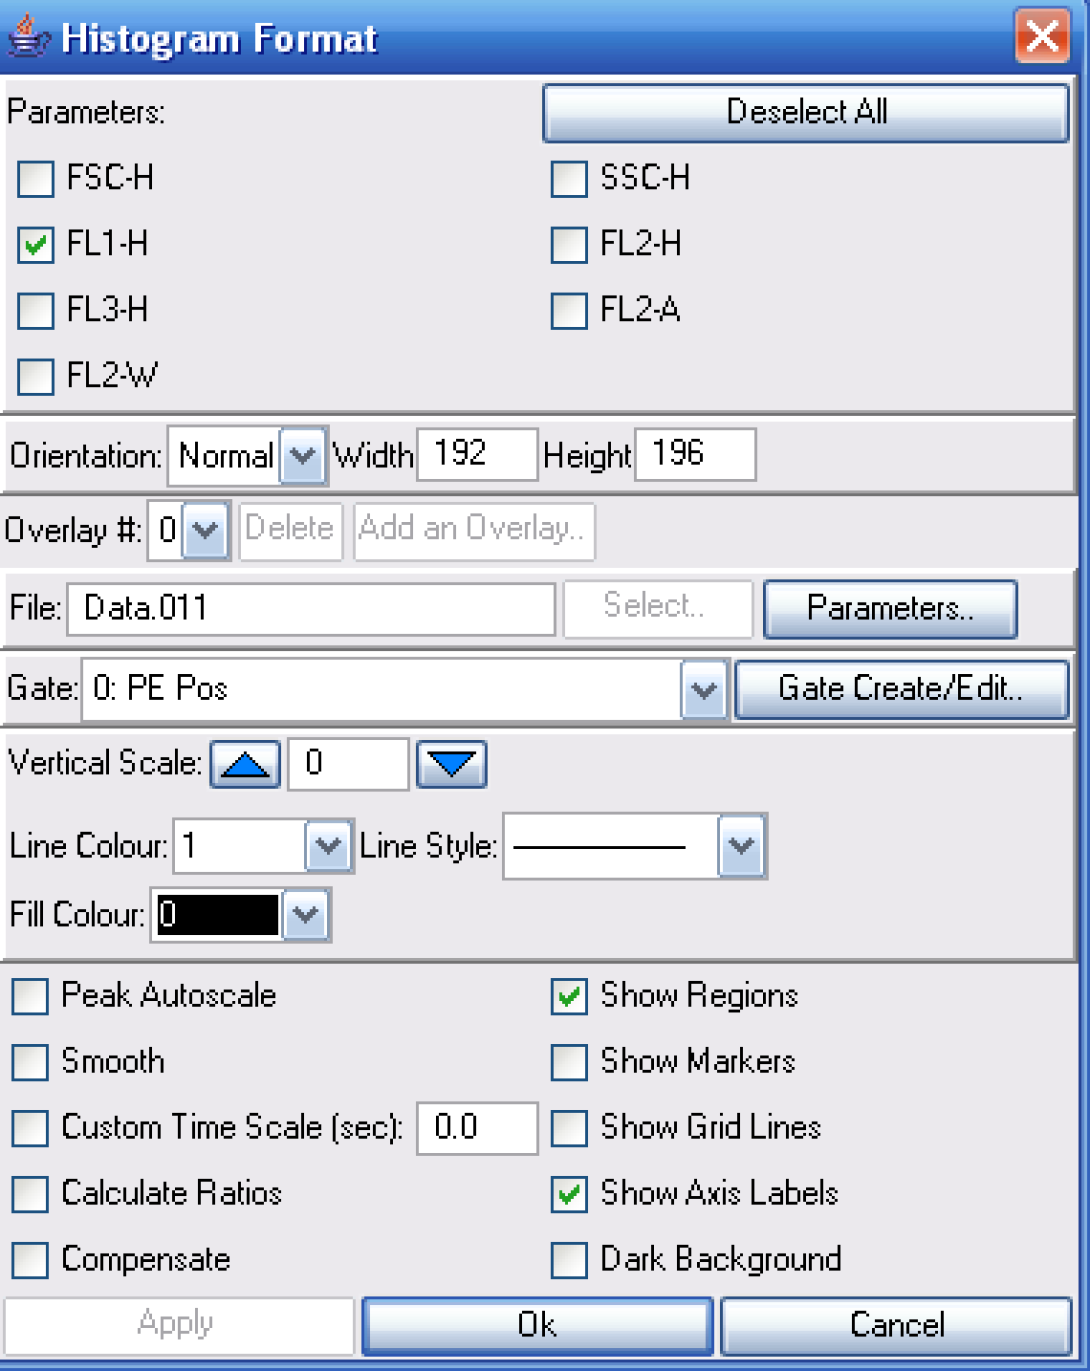
Once the histogram is created, simply right-click on the plot and choose curve fit. This will bring up the Set Fit Parameters windows. Choose the CFSE Fit tab. I generally leave the default options in place unless I expereince problems with the fitting process.
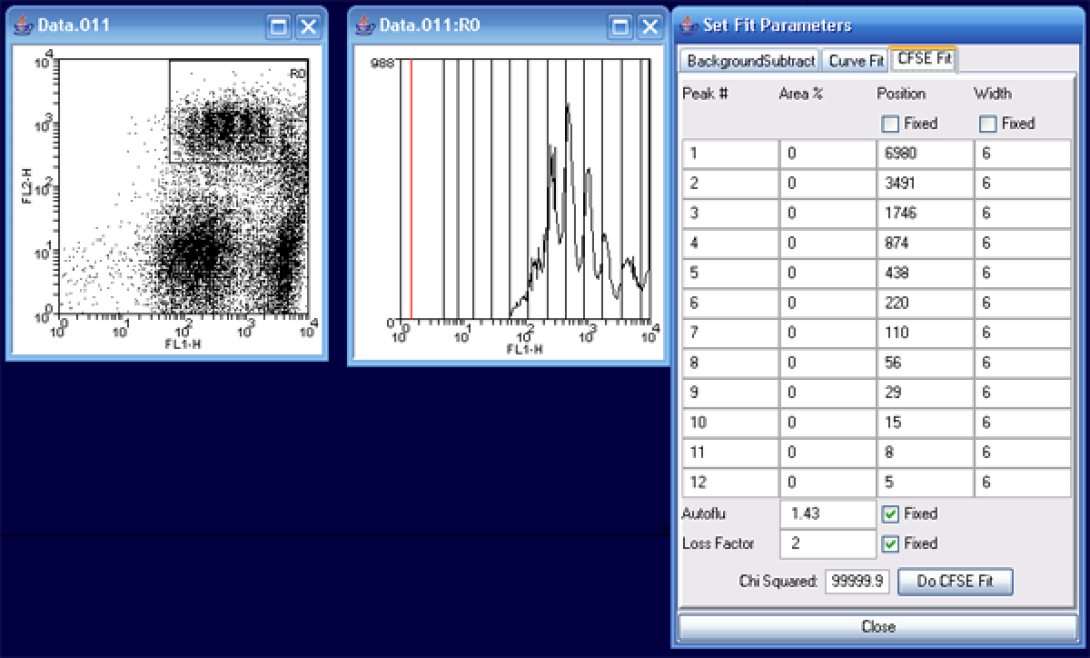
In the histogram, grab the (red) left marker and move it to the beginning of the data peaks. More precisely, this should be set for the maximum point of autofluorescence (background), but as you are not provided with this data, simply moving the marker to the start of the CFSE peaks as above will suffice. Next, click Do CFSE Fit.
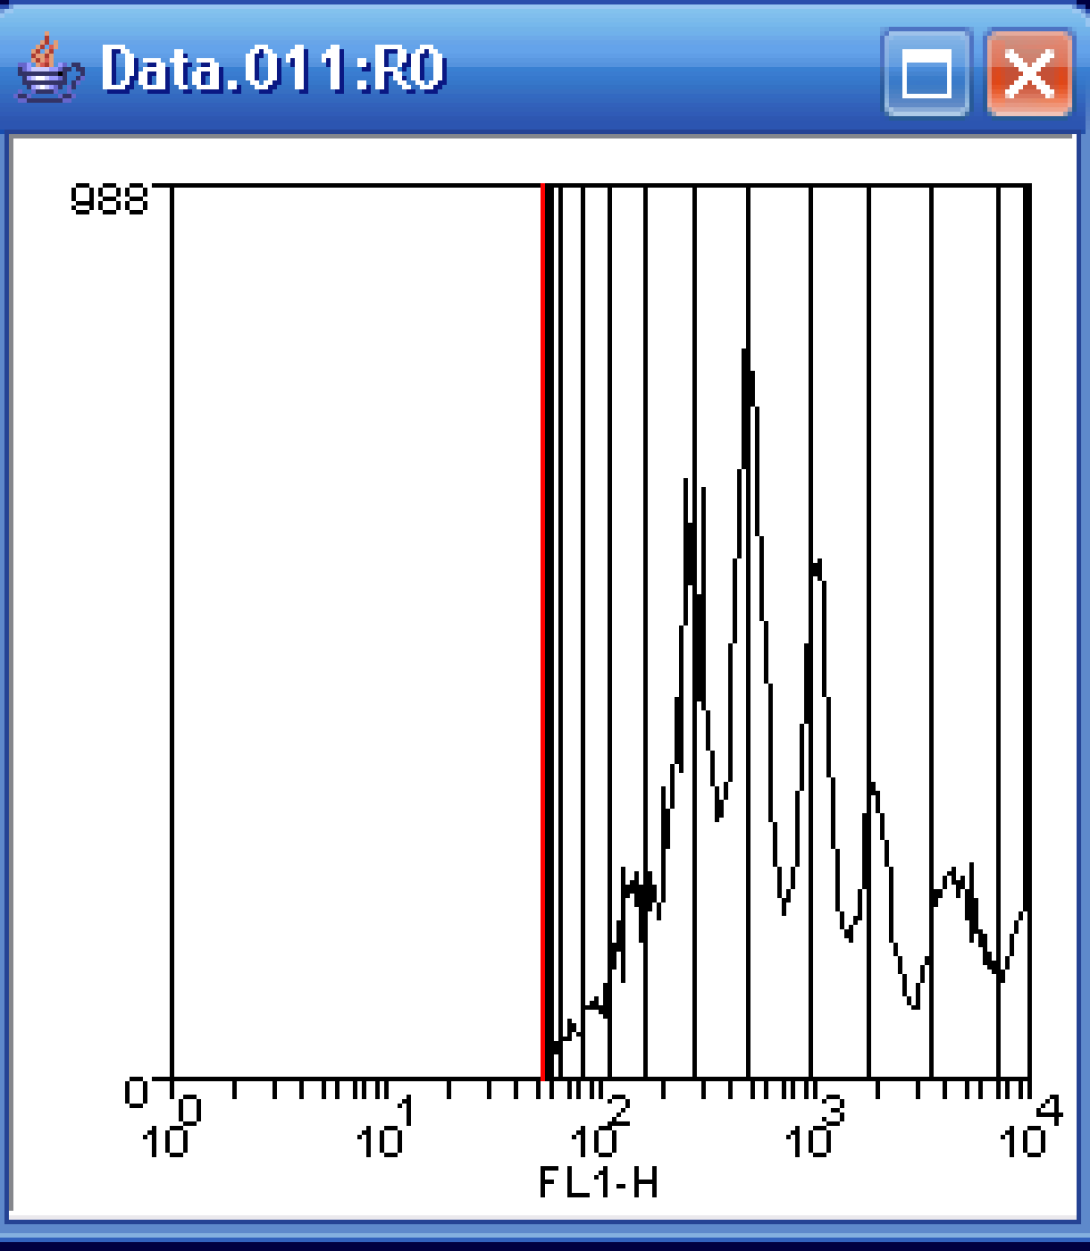
It will likely require several passes to successfully fir the CFSE data. If you are presented with a convergence message window such as this, simply click continue until the fit is complete.

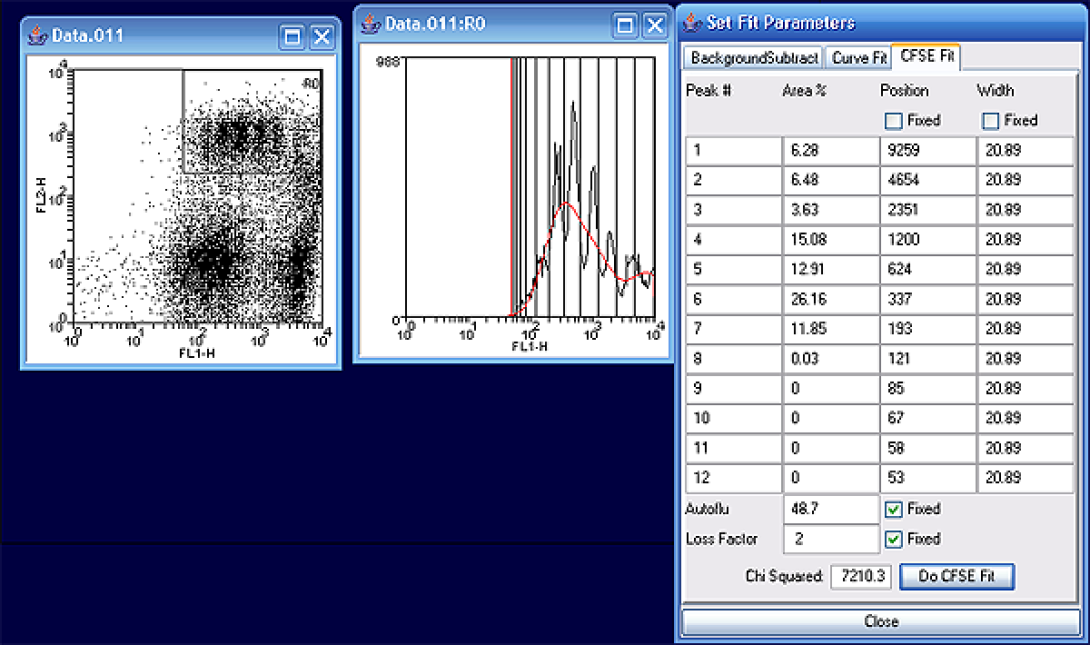
After completion, you will be able to read out the number of measurable divisions (~8) and the percentages in each generation. Notice that the highest number of cells exist in generation six, 26%, according to the curve fit model.
Manual Histogram Fit
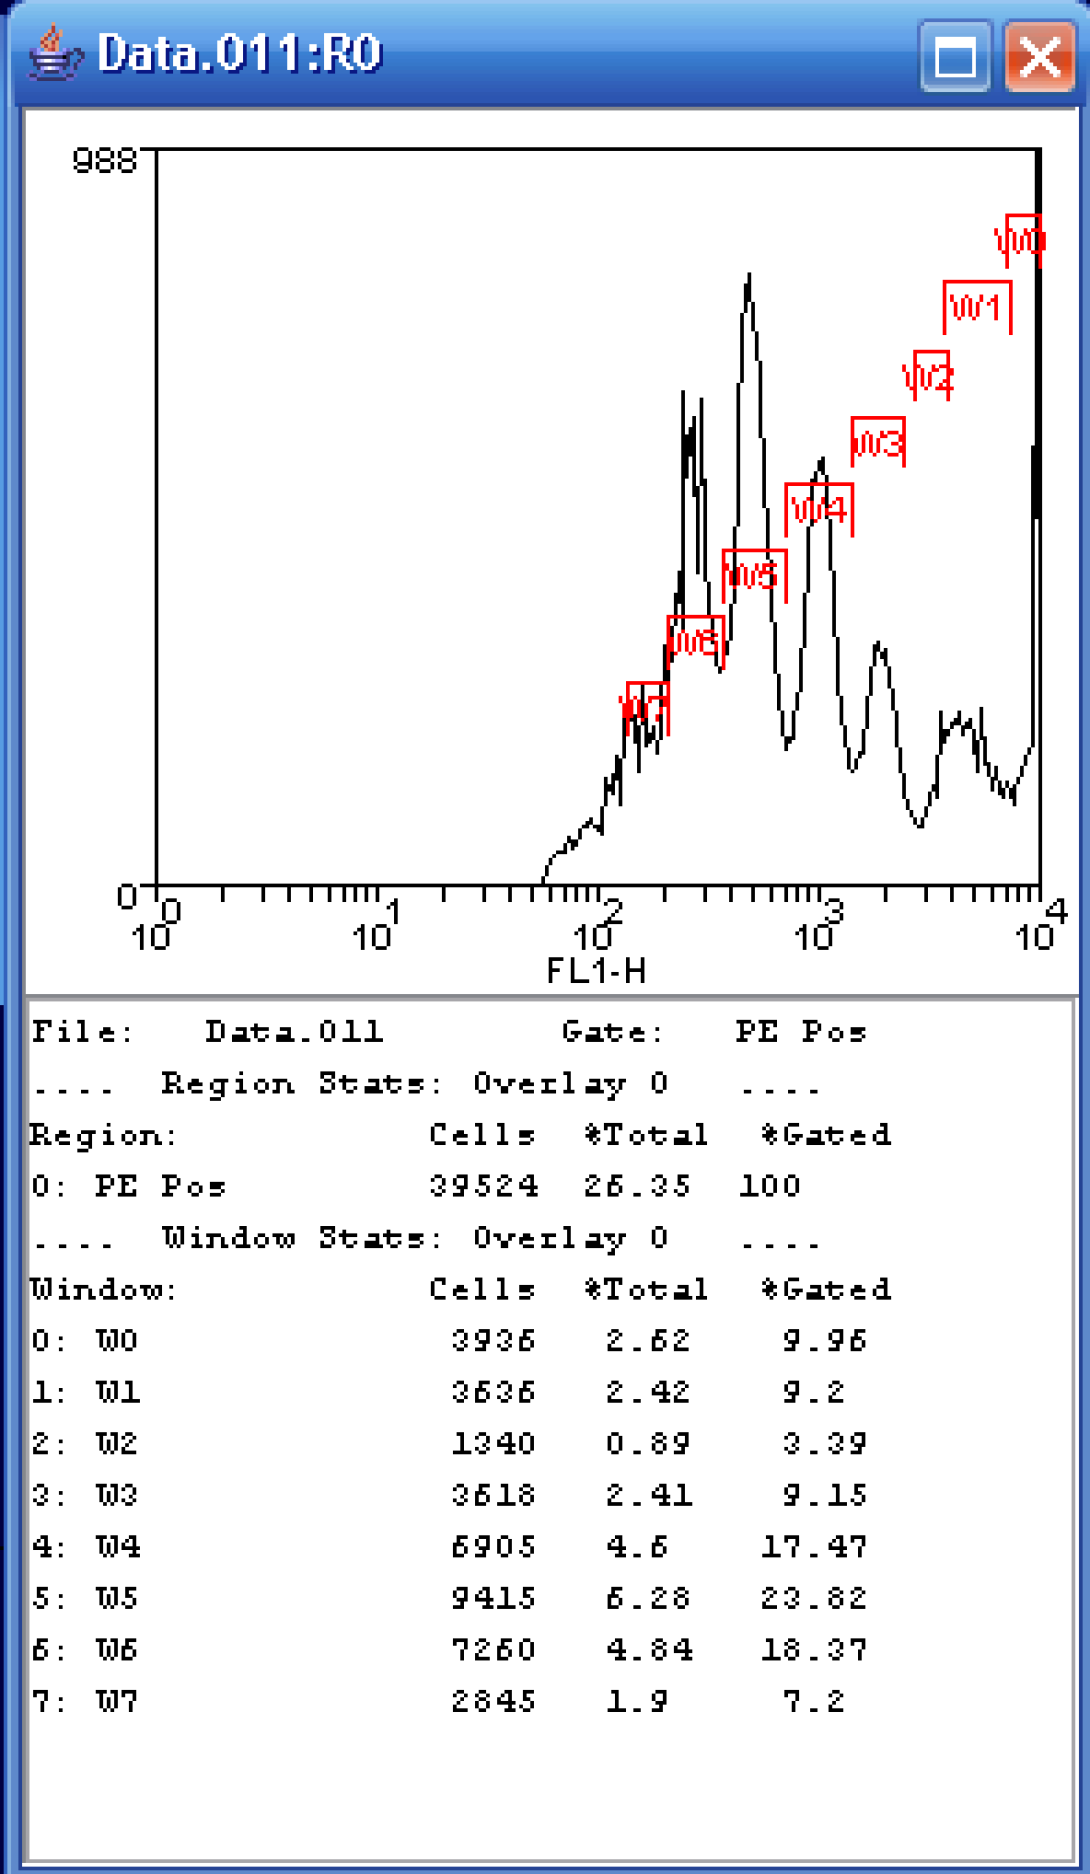
It is also possible to do a manual “fitting” of the data. Let’s return to our FL1 histogram gated on the PE Pos region. I can choose to simply draw regions (right-click, Create Region) over each of the peaks and show the resulting statistics. This is somewhat tricky on the histogram as generations 2 and 3 overlap quite a bit. In the example shown, I am reporting two statistics: %Total and %Gated. I am primarily interested in the %Gated, those cells that fall in the PE Pos region. Notice that the maximum number of cells falls within the W5 gate which represents the sixth generation. The reported percentage is ~24% which is close to that of the curve fit process, certainly close enough if we are just looking for number of generations and relative distributions.
Manual Dot Plot Fit
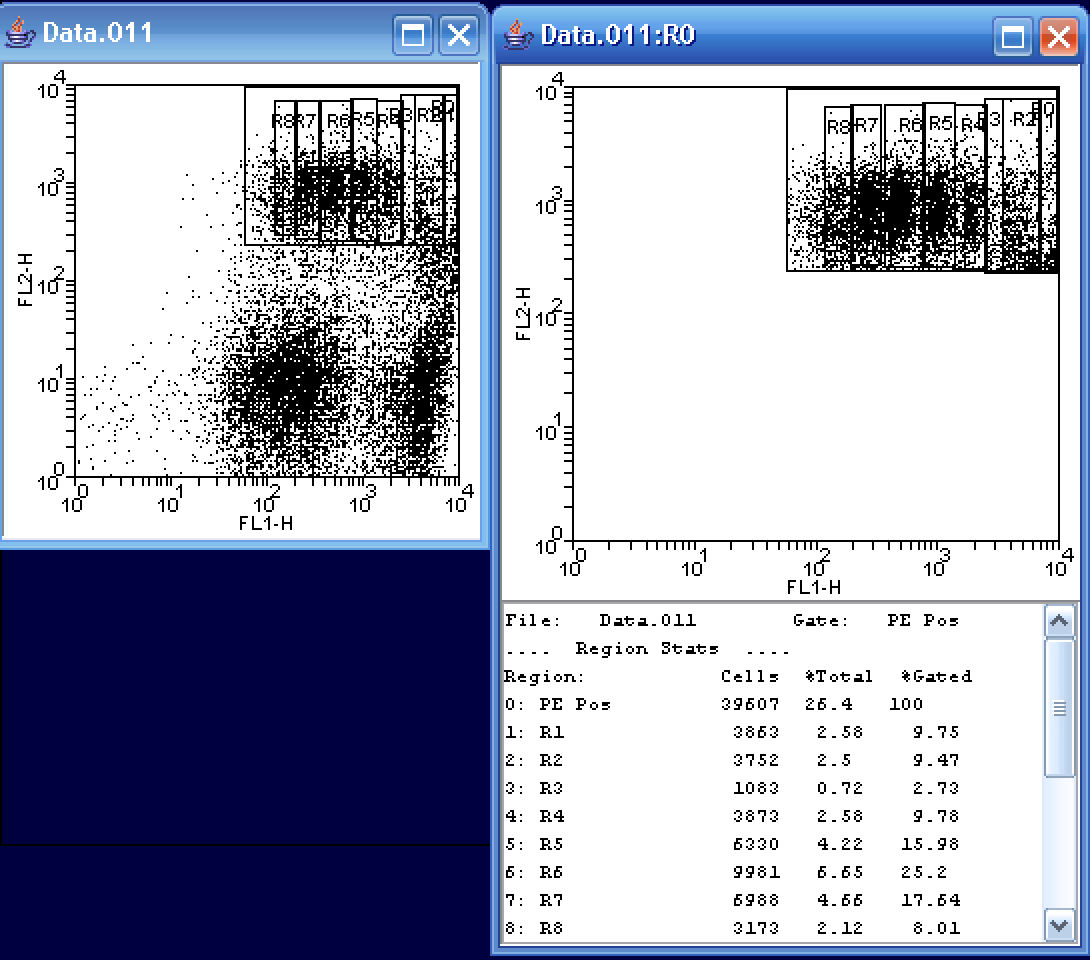
A final way of fitting the data would be to manually draw 2D regions on the FL1/FL2 dot plot itself. In the above example, I found it a bit easier on the eyes to create a second plot showing only the data in the PE Pos region. I then created a series of rectangular regions for each cellular generation. Notice that in this method, it is somewhat easier to distinguish the 2nd and 3rd (R2 and R3) generations. As in the other fits, R3 represents a very small number of cells. Again looking at the %Gated state, R6, the sixth generation, represents the greatest population of cells at ~25%.
As can be seen from the above, there are many ways to approach a CFSE fit. The method chosen depends upon the information needed. If quantitative data is necessary, a modeled fit probably represents the best choice. If, however, relative distribution information is all that is needed, a quick manual fit will provide equally valid data.
Again, special thanks to Sean Linkes for providing the CFSE data.
It is now time to take a closer look at Experimental Design. The choice of markers (antibodies, dyes, etc) and fluorochromes go hand in hand. However, the choice of antibodies is generally dictated by previous work (literature search, ongoing research, etc), and it is when choosing fluorochromes that flow cytometry-specific questions need to be answered. Thus we will focus our attention on how to make intelligent fluorochrome choices.
The Decision Tree
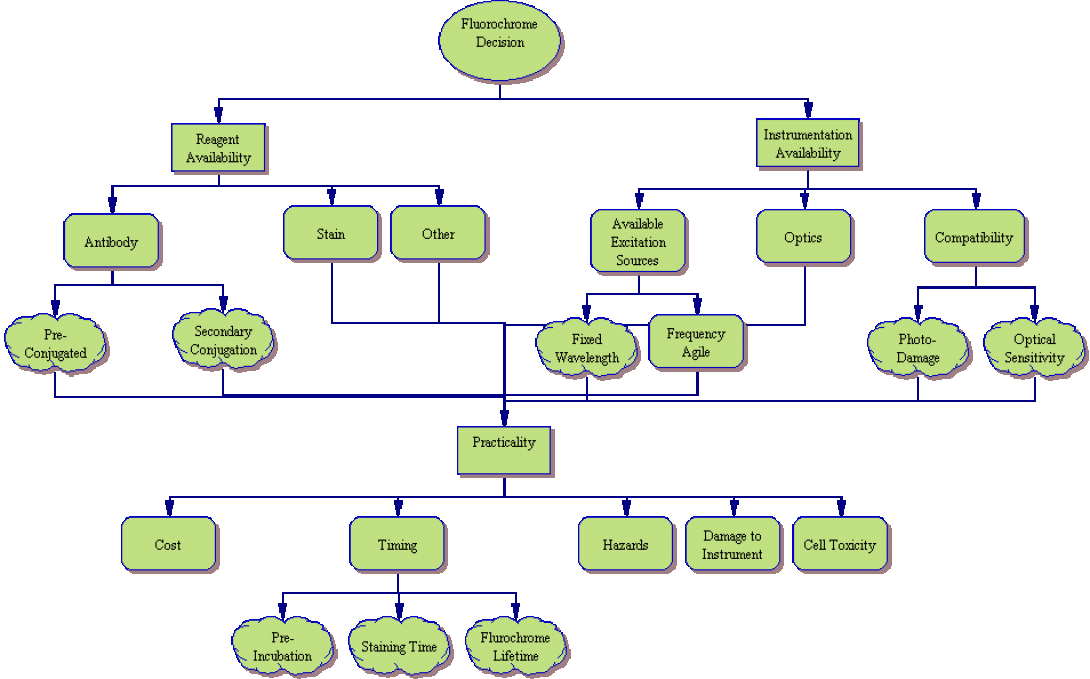
While fluorochrome choice may seem, at first, to be the least of decisions when designing an experiment, as you can see from the process tree above, it is far from simple. Many things must be considered when pairing markers with fluorochromes. In order to simplify the process, lets look at the above tree one piece at a time.
Reagent Availability
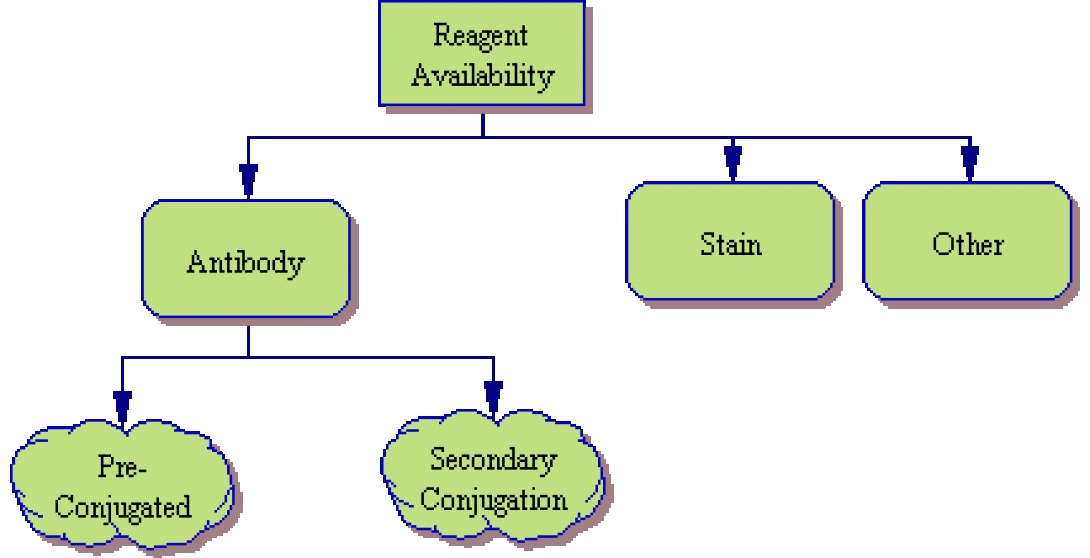
The first item to look at is reagent availability.
- Antibodies – Will you use conjugated antibodies as we discussed in Lesson 5? Are there directly-conjugated antibodies available from a commercial or in-house source or will you need to use a secondary antibody staining such as the Streptavidin/Biotin combination we discussed previously? What fluorochromes (Fitc, PE, APC, etc) are used in the available reagents? Is there a different fluorochrome available if each individual marker (or group of similar-function markers)? If you are using a secondary system, will you be able to limit secondary staining to a single marker or will you need to consider this type of two-step staining for multiple markers? (Please note that while multiple secondary stains are possible, such systems are prone to noise and inaccurate signal measurement).
- Stains – If your experiment includes chemical stains (such as Propidium Iodide, a fluorescent dye we’ve already discussed), what is the excitation and emission spectra of the reagent? Will it interfere with any previously chosen reagents? CFSE, for instance, is a green stain and would be detected in the same channel as Fitc. Therefore, if CFSE is to be used, Fitc should be avoided.
- Other – Remember that any source of cellular fluorescence needs to be factored in to your experiment. Perhaps the cells have undergone viral transfection to insert a new gene. Co-transfection with GFP (Green Fluorescent Protein) would allow for those cells which have successfully incorporated the new gene to produce green fluorescence under standard 488nm laser excitation. Of course, as a green signal, Fitc should, once again, be avoided.
Instrumentation Availability
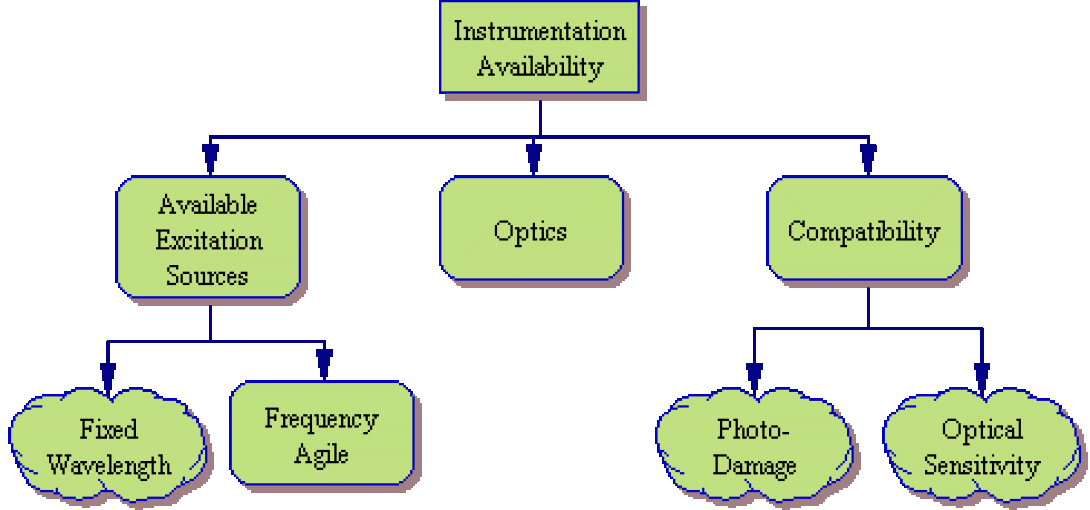
Next, one must consider the instrumentation available to the investigator. A useful chart of common instrument configurations and typical fluorochromes is available here.
- Excitation Sources – What excitation sources (lasers, arc lamps, other) exist on the available flow cytometer? Are the light sources fixed in wavelength or frequency-agile? Are the available excitation sources capable of sufficiently exciting the tentative fluorochromes?
- Optics – What filter/detector combinations are available on the optical deck of the cytometer? Are the available optics capable of resolving the tentative fluorochrome list or will additional optics need to be purchased (if available)?
- Compatibility – Finally, some thought needs to be made as to whether the chosen fluorochromes are compatible with the existing equipment. As an example, if a chosen fluorochrome is prone to Photo-Damage (such as PerCP), it is best reserved for cytometers utilizing low-power laser systems. Other fluorochromes may produce a very weak signal which is best detected via closed flow cell systems rather than less sensitive stream-in-air systems.
Details of available core instrumentation and available excitation sources can be found on the Flow Core web site. Beginning investigators are limited to self-operation of the FACSCalibur and XL analyzers.
Practicality

Finally, after considering available reagents and instrumentation, one must consider whether the available staining protocols are practical in the lab. Some things to be considered include:
- Cost – Unfortunately, scientific work, like everything else in this world, must bend to budgetary constraints. Is the tentative experimental plan cost effective?
- Timing – Many staining procedures have dictated time spans. Whether it is a required pre-incubation prior to staining, incubation time during staining or a short fluorochrome lifetime, it is necessary to look at the experiment from a holistic point of view and determine whether the necessary time and technicians are available. Will there be viability issues?
- Hazards – Not all reagents are innocuous? Will the procedure introduce unnecessary risks for the technicians performing the experiment? Will the procedure introduce an unanticipated potential pathogen. As an example, Lentivirus, an HIV derivative, is a fairly innocuous virus with which to work. However, when co-transfected, it is prone to recombination. Will your procedure cause the lenti to become replication-competent?
- Instrumentation Damage – Will the chosen protocol damage the instrument itself? Acridine Orange, for instance, is a useful cell cycle marker, but is prone to permanently staining the cytometer flow cell and tubing when used improperly. Is the owner of the cytometer willing/able to re-tube the instrument if necessary?
- Cell Toxicity – Finally some markers provide very useful data, but are toxic to the cells. Hoescht stains, for instance, have a high-level of toxicity. Therefore, if the experiment involves collection and reuse of the cells (perhaps for animal injection or cell culture work), this stain is best avoided.
As stated earlier, fluorochrome choice is far from simple. However, by following a careful decision process, it needn’t become a burden.
Wrapping Up
In order to asses your understanding of the material thus far, please email the answers to the following exercise to David Adams.
Using the following chart and your t-cell/b-cell enumeration protocol from Lesson 5, determine if the previous fluorochrome selection is compatible with the FACSCailbur. If not, adjust your protocol accordingly.
Designing an experiment is not, of course, as easy as picking appropriate markers and fluorochromes. In this lesson, we will examine control samples. What do they do and why are they needed?
Instrumental Controls
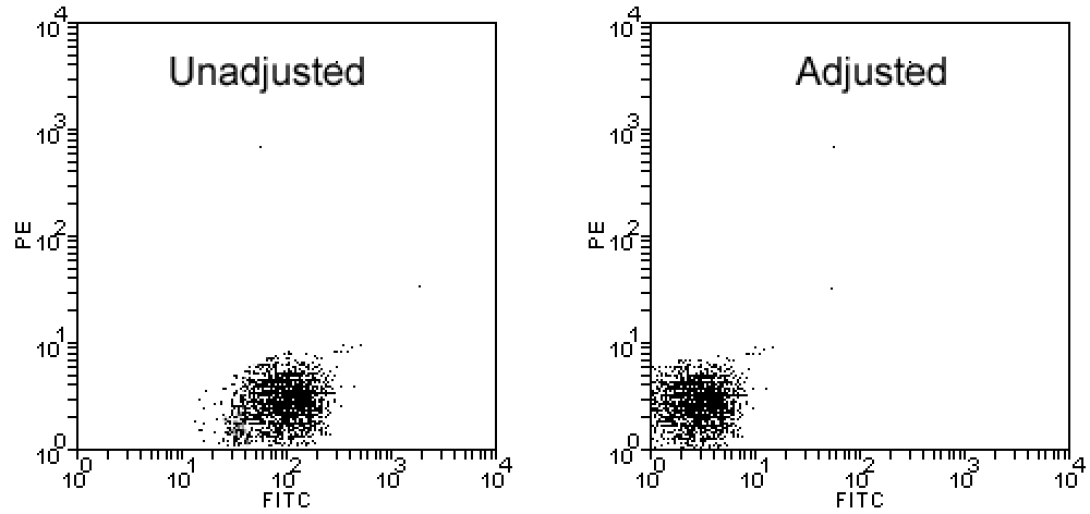
Before placing your costly experimental sample on the instrument, it is important to realize that the scales of the dot plots and histograms that the instrument produces are completely ambiguous. As you recall from our discussion of the PMT detectors, the sensitivity of the instrument can be increased or decreased simply by raising or lowering the voltage applied to the detector. In order to draw any meaningful conclusions from flow data, the plot scales need to first be calibrated. This is done by running a negative control.
A negative control is a sample of the cells under investigation which has not been fluorescently labeled but has, in all other ways (incubations, spins, permeabilization, etc), been treated identically to the experimental sample. This sample is placed on the instrument and the detectors are adjusted (via voltage/amp change) in order to place the negative events in the first decade. The image above shows a negative control prior to and after adjustment. Notice that if a negative control calibration was not completed, the negative sample shown in the unadjusted plot would appear to be negative for PE (true) but positive for Fitc (FALSE!!!!).
Negative controls often fall into one of two categories: Unstained and Isotype.
- Unstained – An unstained sample is just what the name implies. The sample has not been treated with or exposed to any fluorescent reagents. It is sometimes referred to as an autofluorescence control as it is primarily useful for adjusting voltages and indicating the samples innate ability to fluoresce under laser excitation. (Remember: the power density of laser light is very high and everything will fluoresce to some degree, so it is important to know whether the sample fluoresces to a significant degree.)
- Isotype – An isotype control is very similar to the unstained control. The difference is that it has been “stained” with an isotype reagent. That is a reagent that has the same isotype as the target antibody (IgM, IgG, etc) as well as the same fluorochrome but with no epitope-specificity. With no epitope-specificity, it is not expected that any fluorochrome will bind to the cells. However, some cells exhibit a tendency for non-specific binding. If a cell is prone to non-specific binding of a particular isotype, the control samples will show some degree of fluorescence which will have to be considered during the final analysis. If a sample shows 4% non-specific binding, for instance, the final results of the experimental analysis can only be considered plus or minus that 4%!
While many investigators choose to run only one type of negative control, a well-designed experiment includes both unstained and isotype negative controls.
A final negative control to be considered is the Secondary Control. When using a two-step (secondary antibody) conjugation, it is important to run a secondary control. This control is an aliquot of the cells exposed to the secondary (fluorochrome-conjugated) antibody without prior staining with the primary antibody. Again, no binding of the fluorochrome-bearing reagent is expected, but as with anything, it’s generally not a perfect system. Often, there is some tendency for the secondary antibody to non-specifically bind to the cellular membrane causing a false positive signal. The extent of this binding must, again, be quantified and considered in the final analysis.
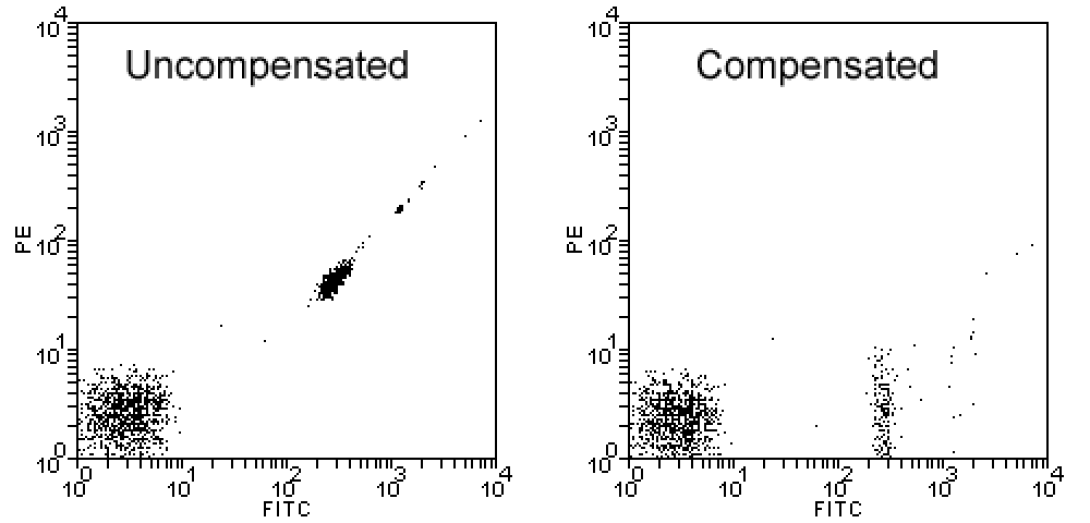
Another necessary instrumental control is the positive control. You have already seen positive controls in lesson 3. A positive control is an aliquot of the cells being studied stained with a single fluorochrome. An individual positive control sample is necessary for each fluorochrome used in the experimental sample. Therefore, a three-color T-/B-cell enumeration experiment would include three positive control samples (one for each color). The primary purpose of the primary control is to adjust compensation as indicated in the image above where the first plot shows a Fitc-only sample prior to compensation and after compensation.
Experimental Control
Experimental controls are familiar to individuals involved in any sort of research. As such, we will not spend any significant time discussing them. However, be aware that it is not uncommon to include an experimental control in flow cytometry experiments in order to verify that everything is working as expected. A typical example would be a cell cycle control. That is, prior to running a multi-sample cell cycle experiment (perhaps as part of a larger apoptosis or drug sensitivity panel), it is not uncommon to run a control sample with a known cell cycle distribution between the phases. This ensures that proper staining has occurred as well as validating instrument operation.
Wrapping Up
In order to asses your understanding of the material thus far, please email the answers to the following exercise to David Adams.
- I am often asked why we use the negative control to place the negative population in the first decade of the axis as opposed to further up or further down the scale. I am now passing this question on to you. From a practical standpoint, why do we fill the first decade of the plots with negative events? Post your thoughts and engage your fellow students to determine the “best” answer to this question.
Please Note: In most cases, the manufacturer will provide an appropriate staining protocol for use with their reagents. This procedure is intended as a general guide to staining.
- If required (peripheral blood, bone marrow), lyse or ficoll cells. Follow with a wash.
- Perform a cell count.
- Pellet cells in cold.
- Add fluorescent stain to cells at manufacturer-recommended concentrationand resuspend.
- Incubate in dark for manufacturer-recommended period (10-30 minutes).
- Wash cells 2x in cold.
- Perform a cell count.
- Resuspend Samples in 12×75 polystyrene culture tubes. Run cells through a40um or 75um filter or nylon mesh to remove aggregates that may clog the instrument.
For Analysis Samples:
Cell Concentration: 1×10⁶ cells/ml
- Fix samples with paraformaldahyde if compatible with experiment
- For Sorting Samples:
- Cell Concentration: 2-5×10⁶ cells/ml
- Do not add any serum to the cells as this interferes with the flow cytometry operation.
- Prepare collection tubes (12x75mm culture tubes or 15ml conical tubes). You may use any collection media desired in the tubes.
Do not forget to prepare control samples. For proper experimental setup, each cell type requires:
- A negative control sample (IgG only)
- For each stain used, a single positive tube (i.e. – for a Fitc vs. PE experiment,one tube should be prepared using only the Fitc antibody, and one tube containing only the PE antibody)
If you have any questions, please contact the main lab at 734-647-3216.
This method, modified from Hoy CA, et.al, is applied to adherent cell cultures. It may also work with suspension cultures, with modifications germane to their culture conditions.
Notes:
- An ideal sample is 1-2 x10⁶ cells. Keep all samples to about the same number of cells to avoid artifacts associated with cell concentration changes.
- Flow cytometry setup controls needed:
- Cells stained with PI alone.
- Cells with no BrdU pulse, and only the antibodies added.
- Amount of BrdU added may vary according to cell type, and proliferative potential.
- BrdU is light sensitive and should be added in the dark.
- Cells pulsed with BrdU may be photosensitive — incubations should be in the dark as well.
Reagents (Product code)
BrdU (5-bromo-deoxyuridine) — Sigma (B-5002)
RNAse A (from bovine pancreas) — Boehringer Mannheim (109-169) Tween 20 — Fisher Biotech (BP337-500)
Triton X-100 — Sigma (X-100)
Propidium Iodide (PI) — Sigma (P-4170)
Ca++, Mg++-free Delbecco’s PBS
HPLC-grade H2O
Fetal calf Serum (FCS)
Internal standard (IS, trout erythrocyte nuclei) – BioSure (1008)
Antibodies
Purified Mouse-anti-BrdU – Pharmingen (33281A)
Goat-anti-Mouse IgG (Whole molecule) FITC conjugate – Sigma (F0257)
Solutions
0.5 mg/ml RNAse A in PBS
PTS — PBS with 0.5 % Tween 20 and 5 % FCS HCl-Triton — 0.1 N HCl containing 0.7 % Triton X-100 PI stock (20 μg/ml in PBS)
Labeling Procedure
- At desired time point(s), incubate cells with 30 μM BrdU for 15 min.
- Remove BrdU media. Rinse 1x with PBS.
- Detach cells — as appropriate; trypsin, EDTA, etc. – and resuspend in 10 ml media.
- Permeabilize cells:Determine cell count. Aliquot desired number of cells per test sample to 15 ml conical tubes. Pellet at 1200 rpm for 5 min at 4oC. Decant supernatant, wash with 3 ml PBS, and re-pellet. Resuspend pellet in 0.3 ml PBS, agitate gently, then add 0.7ml ice-cold 100 % EtOH slowly. Mix gently with a 1 ml glass transfer pipette. The cell concentration following permeabilization should be approximately 106 cells/sample. Samples can be stored in EtOH for up to 2 weeks at 4oC.
- Add IS if desired, at a concentration of 105 IS per 106 cells. Mix gently with a 1 ml glass transfer pipette. Pellet at 1100 rpm for 8 min at 4oC. Decant supernatant, wash with 5 ml PBS, re-pellet and decant supernatant.
- Add 1 ml PBS containing 0.5 mg/ml RNAse A. Agitate tube gently. Incubate at 37oC for 30 min. Add 5 ml PBS, pellet at 1100 rpm, 8 min at 4oC. Decant supernatant.
- Agitate pellet, then resuspend with 1 ml of HCl-Triton solution. Vortex gently. Incubate on ice for 10 min. Add 5 ml PBS, pellet at 1100 rpm for 8 min at 4oC. Decant supernatant and blot gently to dry.
- Add 1 ml sterile HPLC water, vortex gently. Incubate at 97oC for 15 min. Note: be sure to cap tubes loosely to allow for expansion, and keep lid on water bath to control heat range.
- Immediately chill in ice-water bath for 15 min. Add 5 ml PBS containing 0.5 % Tween 20.Pellet at 1100 rpm, 8 min at 4oC. Decant supernatant.
- Add 100 μl PBT. Agitate gently with transfer pipette. Transfer sample to a 1.5 mlmicrocentrifuge tube.
- Add 100 μl of a 1:100 dilution of anti-BrdU Ab. Incubate at RT for 30 min. Add 1.2 mlPBT. Pellet at 3200 rpm for 2 min in a microcentrifuge (Eppendorf Centrifuge 5415 C). Decant supernatant. Note: Speed and time are IMPORTANT — at this point, the pellet is very loose and it may be necessary to re-pellet.
- Add 150 μl of a 1:20 dilution of FITC-conjugate Ab. Incubate at RT for 30 min. Add 1.2 ml PBT. Pellet at 3200 rpm for 2 min in a microcentrifuge.
- Resuspend pellet in 0.5 ml PI stock solution. Transfer sample to a 0.5 ml snap-top microcentrifuge tube. Cover samples with foil.
- Leave samples at RT for 1 hr before taking them to the Flow Lab.
Reference
Hoy CA, Seamer LC, Schimke RT. Thermal denaturation of DNA for immunohistochemical staining of incorporated bromodeoxyuridine (BrdU): critical factors that affect the amount of fluorescence and the shape of the BrdU/DNA histogram. Cytometry, 10: 718-725, 1989.
Prepared by Leo J. Ostruszka and Mary Davis, Ph.D. Refer questions to Leo at 734-763-7887.
Acridine Orange (AO) is a nucleic acid selective metachromatic stain useful for cell cycle determination. AO interacts with DNA and RNA by intercalation or electrostatic attraction respectively. DNA intercalated AO fluoresces green (525nm); RNA electrostatically bound AO fluoresces red (>630nm). It may distinguish between quiescent and activated, proliferating cells, and may also allow differential detection of multiple G1 compartments1. AO may also be useful as a method for measuring apoptosis, and for detecting intracellular pH gradients and the measurement of proton-pump activity2.
This procedure optimally stains cells for analysis by flow cytometry.
Stock Reagents
0.1M Citric Acid
(Citric Acid, anhydrous (FW 192.1); 1.921g per 100ml dH2O)
0.2M Dibasic Sodium Phosphate
(Sodium Phosphate, dibasic anhydrous (FW 142.0) 2.839g per 100ml dH2O)
Triton X-100 (Baker)
0.5M EDTA, disodium salt (SIGMA) NaCl (FW 58.44)
Acridine Orange (Polysciences or SIGMA) Sucrose, anhydrous (FW 342.3; SIGMA)
Stock Buffer I
20mM Citrate-Phosphate, pH 3.0, 0.1mM EDTA, 0.2M Sucrose, 0.1% Triton X-100
(To 125ml dH2O add 40μl 0.5M EDTA, 26.48ml 0.1M Citric Acid, 6.85ml 0.2M Dibasic Sodium Phosphate, 13.69g Sucrose, 0.2ml Triton X-100. QS to 200ml and 0.2μ filter. Store at 4oC)
Stock Buffer II
10mM Citrate-Phosphate, pH 3.8, 0.1M NaCl
(To 150ml dH2O add 9.92ml 0.1M Citric Acid, 5.46ml 0.2M Dibasic Sodium Phosphate, 1.7g NaCl. QS to 200ml and 0.2m filter. Store at 4oC)
Staining Cells
- Make a 2mg/ml AO in dH2O solution – dilute to 1:100 in Buffer II
- Aliquot cells: 105 – 106 in 100μl PBS or media
- Add Buffer I (0.5ml) at room temp, agitate to suspend
- Add Buffer II + AO (0.5ml) at room temp, agitate to suspend
- Run on flow cytometer. (Setup will require some red-green compensation to optimize G1 %c.v.)
1 Darzynkiewicz Z. Differential staining of DNA and RNA in intact cells and isolated cell nuclei with acridine orange. Methods in Cell Biology. 33:285-98, 1990
2 Darzynkiewicz Z. Bruno S. Del Bino G. Gorczyca W. Hotz MA. Lassota P. Traganos F. Features of apoptotic cells measured by flow cytometry. Cytometry. 13(8):795-808, 1992
The following outlines the procedure for staining and analysis of cells using Hoechst 33342 (H342). Modifications may be required depending on the application and with variable response of individual cell types. H342 is a “vital” DNA stain that binds preferentially to A-T base-pairs. The cells require no permeabilization for labeling, but do require physiologic conditions since the dye internalization is an active transport process. This condition typically varies among cell types, but the following procedure will give good results in most cases.
- Stock H342 solution: H342 should be originally suspended in dH2O at a 1mM concentration (H342 will precipitate in PBS).
- Cell suspension: This procedure is very sensitive to cell concentration and pH of the media. Cells should be approximately 1-2×10⁶/ml, in buffered media, pH 7.2. It is also helpful to include 2% fetal calf serum to maintain the cells.
- Add H342 dye from the stock solution to cell suspension to 10µM final concentration.
- Cells are then incubated at 37oC for 1 hour. Time is a critical factor due to the transport of the dye. Typically, 30 minutes is a minimum, but it is important to remember that the signal may begin to degrade after ~120 minutes. It is recommended that the staining kinetics be empirically defined.
- Analyze by flow cytometry immediately after incubation. Washing is not recommended (see step 4). H342 stained cells will be illuminated with an argon laser tuned for UV (353-365nm) and resulting fluorescence will be detected at 480nM. H342 has a broad fluorescence range, allowing for co-staining with nonUV excitable fluorophores and correlated analysis of other extrinsic cellular characteristics. H342 will also work with PFA or EtOH-fixed cells, with modification to the above protocol, usually calling for a reduction of H342 concentration (to ~1µM). Dye incubation time is drastically reduced (to ~15 minutes) since the cells are permeabilized while fixing.
Propidium Iodide (PI) DNA Labeling following Ethanol Fixation
The following outlines the procedure for quickly fixing and labeling cells for flow cytometric analysis of cellular DNA content. Several points should be considered before labeling:
Viability — Low viability can dramatically affect the quality of results, due to added sensitivity to handling and the potential for increased subcellular debris. Also, free DNA fragments can lead to increased clumping and noise, thus confounding resultant histograms. If problems with viability or debris are concerns, adding a DNASE to the wash buffer BEFORE fixation with ethanol can improve histogram quality.
Cell number — Cell concentration can affect PI signals. This procedure is appropriate for the indicated cell number. Counts dramatically disparate from this (e.g., a factor of 5) will change critical dye:cell dynamics, possibly resulting in artifactual peak shifts. Accurate knowledge of FINAL cell counts (following all treatments/manipulation) is recommended.
Internal standards (IS) — Controls used in peak positioning and ploidy determination should be processed the same as experimental specimens. When adding IS (e.g., trout or chicken red cell nuclei), be sure to maintain a reasonable cell:IS balance; too many IS cells may overwhelm and confound the analysis.
Note: Cultured cells and ficoll separated nucleated cells from whole blood should be washed 1x before fixation to remove serum-based proteins that may precipitate in ethanol.
1. Count cells. Pellet 0.5-1 x 10⁶ cells per sample. Resuspend in 0.5 ml PBS.
Note: never add fixative to a cell pellet — may cause clumping and loss of sample.
2. Add 0.5ml 100% cold ethanol, drop-wise while vortexing. Incubate for a minimum of 20 minutes.
3. Pellet cells (1000 rpm for 5-7 minutes) then carefully invert tubes to decant ethanol. While inverted, gently blot tubes to wick away excess ethanol.
Note: Removing all of the ethanol is not essential — trace remaining will be diluted.
4. Add 0.5ml PI-RNAse solution (final concentrations: 50μg/ml PI + 100μg/ml RNAse Type I-A in PBS). Mix well, then incubate (room temperature in the dark) for a minimum of 20 minutes.
5. Analyze by flow cytometry. Acquire a minimum of 5 x 10³ cells in a histogram, if possible.
Propidium Iodide Staining for Sub-G1 Analysis: Hypotonic Lysis Method
This method will result in free nuclei, stained with propidium iodide for measurement of relative DNA content. Cells undergoing apoptosis will lose part of their DNA (due to the DNA fragmentation in later apoptosis). Those cells may be detected as a “sub-G1” population. Reagents: Sodium Citrate Triton X RNAse (Type I-A) Propidium Iodide (PI) Deionized (DI) H20 PBS (Ca++/MG++ free) PI-Hypotonic Lysis Buffer: (in DI H2O) 0.1% Sodium Citrate 0.1% Triton X 100 μg/ml RNAse 50 μg/ml PI Procedure: Harvesting, washing and counting methods will vary with cell type, origin, and treatment. Buffer is optimized for 1 x 10⁶ cells per sample. Using more or less may require adjustments.
- Aliquot 1 x 10⁶ cells to 12 x 75 mm tube.
- Wash once with cold PBS. (optional)
- Pellet, remove supernatant.
- To pellet: Add 500 μl PI-Hypotonic Lysis Buffer.
- Agitate pellet gently.
- Analyze by flow cytometry after a minimum 20 minute incubation; within 2 hours of hypotonic treatment.
Changes in cellularity may result in artifactual shifts in DNA peaks, as the available dye per cell ratio varies. We recommend use of an internal DNA standard (trout erythrocyte nuclei) to correct for this, available from BioSure (Grass Valley, CA . . . see flow lab personnel for more information).
This protocol is a condensation of efforts from Dr. Arne Kolstad and Missy Tuck (734-763-4428), and M. KuKuruga (Flow Core).
This protocol describes the loading of cells with indo1-AM for the purpose of measuring cellular calcium levels. This acetoxymethyl ester form of the dye is cell-permeant, passively diffusing across the cell membrane. Intracellular esterases cleave the acetyl groups, rendering the indo-1 impermeant.
Indo-1 is excited in the UV, and fluoresces at different wavelengths depending on whether it is bound to calcium (~420nm) or free (~510nm). The ratio of these two wavelengths can indicate changes in intracellular calcium concentration. Indo-1, because of the ratiometric quality, is the dye of choice for most flow applications. There are other dyes, most of which shift in fluorescence intensity rather than a wavelength in reaction to changes in calcium levels. Alternatives to indo-1 may be useful, depending on your ultimate goal.
The optimal concentration of indo-1 varies with cell type, ranging from 1 to 10 mM. This typically requires empirical definition, but note that concentrations at the low end of the range tend to yield more sensitive measurements. Cells loaded with indo-1 are analyzed relative to a time parameter, and the change in fluorescence ratio over time can be related to changes in activation or stimulation by some agonist that will illicit a calcium flux. Ionophores, usually ionomycin, are used as positive controls. Calcium chelators such as EGTA serve as negative (Ca++ low) controls.
Reagents
DMEM
PBS
DMSO
Cell Loading Medium (CLM; RPMI, 2% FCS, 25mM HEPES (pH 7.4))
Indo-1 AM (Molecular Probes I-1203) (stock: 1mM in DMSO)
Ionomycin (1mg/ml in DMSO)
EGTA
Procedure
- Suspend 10-20 x 106 cells in 1ml CLM in 15 ml tube.
- Load cells with indo-1, final concentration 1.5µM (1.5µl of 1mM stock in DMSO).
- Incubate cells 45 minutes at 37oC in the dark.
- Wash cells 2X with DMEM with 2% FCS.
- Resuspend cells gently (DO NOT VORTEX) in CLM at 2.5 x 10⁶ cells/ml. Store in the dark at room temperature until about 1-hour flow cytometric analysis.
- Dilute cells to 1 x 10⁶/ ml with CLM. Allow to equilibrate at 37o C in the dark for 30-60 minutes.
- Analyze by flow cytometry. Run untreated cells to establish a baseline; run “positive” control to establish maximum Ca++ flux ratio; run EGTA inhibited cells to approximate low (minimal) response.
Positive control: Ionomycin, 1ug/ml final concentration (stock 1mg/ml in DMSO)
Negative control: EGTA 8mM final concentration; add to indo1-loaded cells (step 6) approximately 1 hour prior to flow cytometric analysis.
1150 West Medical Center Drive
Ann Arbor, MI 48109
109 Zina Pitcher Place
Ann Arbor, MI 48109
2800 Plymouth Road
Ann Arbor, MI 48109